The reviewer has made very common but tragic mistakes. There are many papers showing extreme problems with all the methods the reviewer likes. May need to go to a journal that has qualified statistical reviewers. Start with papers by Margaret Pepe. Bad power from studying changes in c-index can be easily simulated; can’t put my finger on a paper. But if you keep trying that journal you might mention that the original developer of the c-index backs you up.
2 Likes
Thank you very much for your reply. I will definitely start with the Pepe ones. I wish all journals had qualified statistical reviewers…
Do you perhaps have a good reference to cite, where is stated that p-values for differences in c-statistics and p-values for NRI and IDI are problematic? Would really much help me.
I am currently trying to familiarise myself with the literature on this, but as I only have a layman’s background in statistics, this is of course very challenging.
I’m sure someone can find such a reference for us. Think about it this way: Differences in c equate to differences in Wilcoxon statistics. If doing Wilcoxon tests to compare A with B and B with C no one computes the difference in two Wilcoxon stats to compare A with C. That would detect weird alternatives and have poor power.
1 Like
Ugh… I feel for you Julia.
@f2harrell giving permission to name drop him is great!
Margaret Pepe’s papers about NRI:
-
Pepe MS, Fan J, Feng Z, et al. The Net Reclassification Index (NRI): A Misleading Measure of Prediction Improvement Even with Independent Test Data Sets. Stat Biosci 2015; 7: 282–295.
-
Pepe MS. Problems with risk reclassification methods for evaluating prediction models. Am J Epidemiol 2011; 173: 1327–1335.
I think Jorgen Gerds wrote about the IDI and issues when there was miscalibration of models.
2 Likes
Julia, I defer to the world class experts here but there are clinical considerations which I have learned over the past 4 decades of studying the clinical behavior of relational time series matricies of biomarkers, matrix patterns and derivatives. These affect the validity of the statistics.
It is first important to consider:
- What type of biomarker(s) you are investigating?
Biomarkers may be derived directly from the condition under test (hcg) or indirectly from a complication (creatinine), a general mortality signal (lactate) or a physiologic response to the condition (WBC)?
- What type of condition you are investigating?
A well defined disease or a broadly defined synthetic syndrome comprised of many diseases?
-
What is the volitility of the biomarker. (what is the derivative range of the biomarker with and without the condition under test )?
-
What factors affect the biomarker volitility and is this volitility a function of the condition?
-
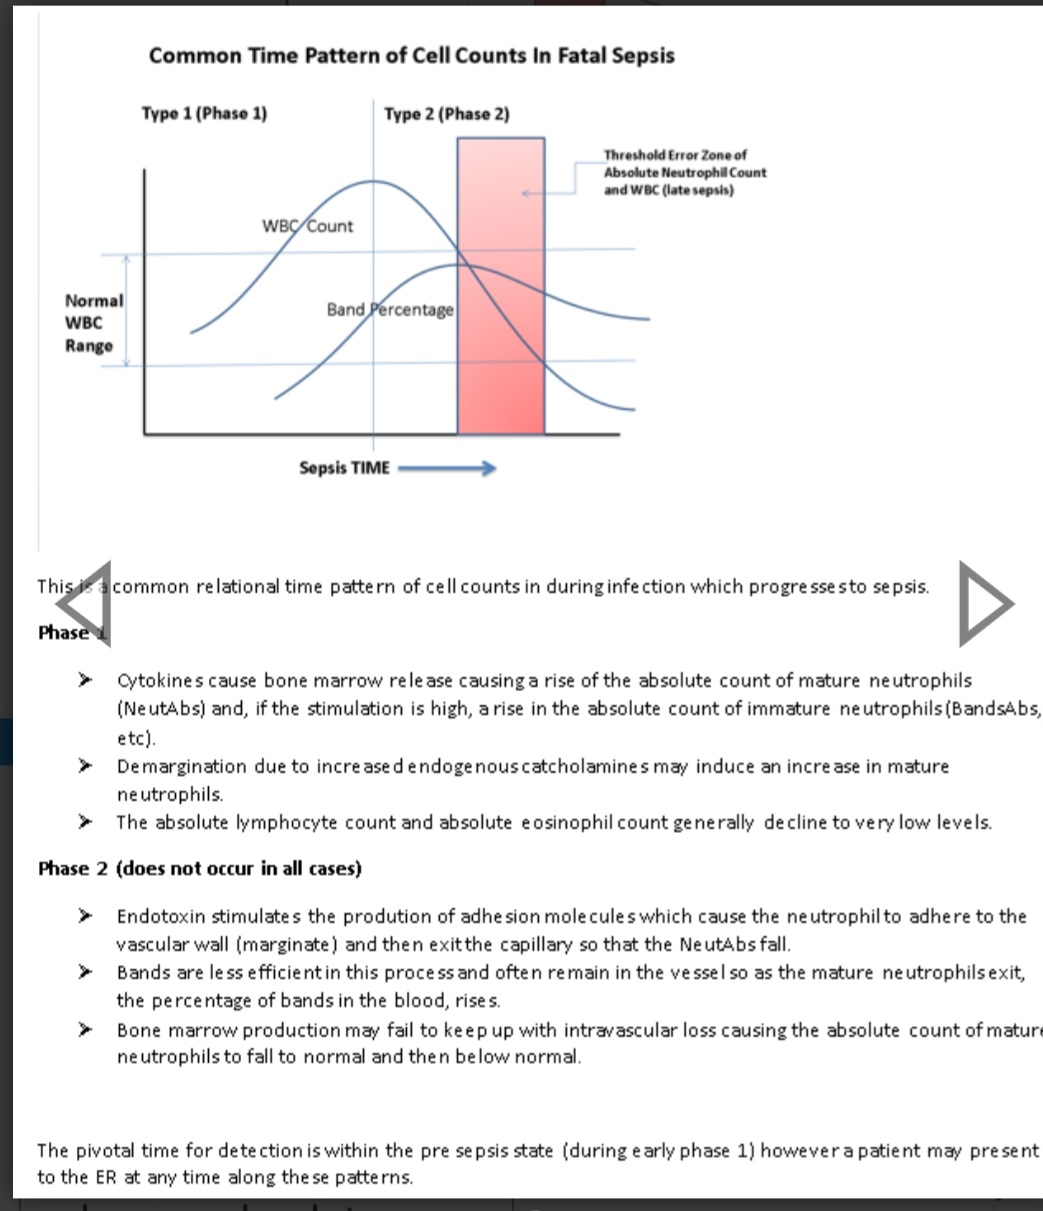
Is the biomarker depletable or biphasic. (WBC is a depletable biomarker often high early and low late)?
6 Is the biomarker a late marker such that it is generally normal early in the disease (eg bands, lactate)?
-
Does the biomarker have a high normal phenotypic range. (eg platelets)?
IMHO, these are pivotal considerations and it is intuitive that these account for much of the failure of AUROC as a stand alone biomarker test.
In an example, bands (a type of immature neutrophil), were abandoned in many hospitals because biomarker studies demonstrated that the absolute neutrophils had a better AUC. However both are “response biomarkers”, moderately volatile biomarkers, and bands are late markers whereas absolute neutrophils are both early markers and depletable.
Had the authors of these studies engaged in due considerations of the above relational times series matrix factors they would not have determined that absolute neutrophils were superior to (and could replace) bands.
The loss of bands as a biomarker in many hospital systems remains and has echoed in the halls of the ICU as a function of very late detection of life-threatening infection for decades.
4 Likes
Published yesterday in Circulation: https://doi.org/10.1161/CIR.0000000000001401
It’s an AHA Scientific Statement: “Criteria to Assess the Predictive and Clinical Utility of Novel Models, Biomarkers, and Tools for Risk of Cardiovascular Disease: A Scientific Statement From the American Heart Association”
I am wondering, why the “changes in the C-statistic” is again highlighted as well as “Categorical NRI […] at event rate […]” and in the whole statement there is not even one sentence about Likelihood ratio importance?? 
5 Likes
This is way behind the times, and NRI has been particularly criticized in biomarker research.
1 Like
Way too sad, that this statement got published and will now always be referenced by clinicians/cardiologists for „best practice“ 
As kind of a junior researcher it is very hurtful to see this and already knowing that the fights against senior clinicians regarding LR and not doing NRI and testing delta c-statistics, will now be even more painful….
Human nature disappoints me in so many ways. One of them is the laziness involved in not wanting to learn better approaches to problem solving and life in general. Too many researchers continue to rely on the first method they learned, or trust what their colleagues have published or what their favorite journal allows people to get away with.
5 Likes
This is a complaint.
I used decision curve analysis in my paper and wrote the following expression. A collaborator told me that I was treating clinicians like idiots. I might lack sufficient knowledge, but I don’t understand why saying this is considered treating clinicians like idiots. Is this sentence offensive?
However, the C statistics are challenging for clinicians to interpret. The incremental predictive value of triglyceride levels requires interpretable metrics for quantification.
1 Like
Hi Jiaqi
As a clinician who just googled “C-statistic,” I’m not offended by what you wrote. Most clinicians have only rudimentary statistical training at best. If someone with statistical training considers that a statistic could be tricky for clinicians to understand, it almost certainly will be.
2 Likes
In line with that I would challenge the offended physician to interpret a difference in two concordance probabilities. I’m not holding my breath for a correct answer.
2 Likes
Honestly I do think c-statistics are quite interpretable, but not very useful for clinical decision-making.
Yes I think they are interpretable by statisticians and some others but are not on the needed clinical scale (as opposed to distributions of assigned risk e.g. this).
3 Likes
My understanding is that the C statistic of a simple model is interpretable and is an essential metric. What I intend to convey is that comparing C statistics is difficult to interpret. Adding a new factor to a model typically yields small improvements. For example, from 0.70 to 0.72, the practical interpretation of such a result is unclear. Or is this difference interpretable?
The difference between c-index of 0.72/0.70 means that the first model has 2% higher chance to guess the event in an imaginary game that samples one event and one non-event from the validated data.
The real issue is not the interpretability, but the relevance for decision making.
Considering new biomarkers must come with cost, c-index can’t help you with these kind of decisions.
PS: That’s my attempt to explain c-index (and why I don’t like “area-under-curve” interpertation):
1 Like
Yes, the AUC being the concordance probability is the only good thing about the curve. But it should only be used when there is a single model under consideration, as concordance probabilities are too insensitive to detect added information. I’ve never seen a helpful ROC curve.
1 Like
Methodologically this interpretation is valid. My point regarding inexplicability refers to the limited clinical interpretability or practical utility. I agree with your reasoning and think your slides are great and very easy to understand.
I would like to add that the C statistic yields the same concordance when comparing non-cases and cases whether the predicted probabilities are 0.3 and 0.7 or 0.1 and 0.9 because it only evaluates the rank order. The latter may represent better prediction as the values approach 0 and 1. . This is another reason why I find a 2% difference between two C difficult to interpret. Even disregarding costs a 2% margin can hardly be characterized as a correct improvement in prediction.
2 Likes
Honestly the only performance metrics I care about from the “Discrimination” category are PPV and Lift - but they also hardly related to patient-specific decision making and more about organization-resource-constraint type of decision making.
2 Likes
The final goal of prediction is to provide information that supports clinical decision-making, and I believe we are aligned on this point. This is also why I am angry. I am trying to provide information that is suitable for explaining to physicians and patients and for facilitating decisions (at least that is what I think), then I am being accused of treating physicians as if they lack expertise.
2 Likes