95% prediction intervals for risk calculator

Hi all, I asked this on Cross-Validated (https://stats.stackexchange.com/questions/362482/equation-for-standard-error-of-linear-predictor-and-95-prediction-intervals-fro) but I figured this would be an even better place.

I would like to present 95% prediction intervals in an online risk calculator.

  1. After fitting a logistic model with lrm (which includes some restricted cubic splines), I export the equation using latex() and program the model as a risk calculator.

  2. The trouble is that I want to also find the equations for the upper and lower limits of the 95% prediction intervals around the predicted probabilities to help users see the uncertainty in the predictions.

  3. I know how to produce prediction intervals using the predict(model,data,type="lp",se.fit) method, but it is not the actual values I am interested in. Rather I need to get the equation.

The scenario is a common one in risk modelling but risk calculators very rarely show upper and lower prediction intervals.

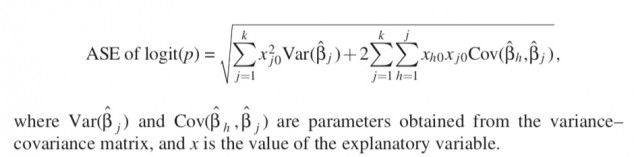
How to calculate standard errors of the linear predictor?

From Sofroniou N, Hutcheson GD. Confidence intervals for the predictions of logistic regression in the presence and absence of a variance-covariance matrix. Understanding Statistics: Statistical Issues in Psychology, Education, and the Social Sciences. 2002 Feb 2;1(1):3-18.

Asymptotic standard error of logit

Not sure how I can create a single equation in the form logit§ = B1X1+1.96ASE_of_B1 + B2X2+1.96ASE_of_B2… that I can then work with in excel or javascript etc to give people upper and lower 95% prediction limits.

Initially I thought I could just do something like:

#the main lrm object
fit<-lrm(y~rcs(x1,3)+x2+x3,data=data,X=T,Y=T)

#just creating some lrm objects to update later for user with latex()
fit.ucl<-fit
fit.lcl<-fit

#update the coefficients in the lrm objects to represent the upper and        
#lower bounds of the confidence intervals
fit.ucl$coefficients<-(fit$coefficients + 1.96*(sqrt(diag(vcov(fit)))))
fit.lcl$coefficients<-(fit$coefficients - 1.96*(sqrt(diag(vcov(fit)))))

#output the equations for each in latex
latex(fit)
latex(fit.ucl)
latex(fit.lcl)

but this is using only the diagonal of the vcov matrix and doesn’t take into account the off-diagonals (the covariances) as the above equation requires.

My model also includes restricted cubic spline-transformed variables, the interpretation of which is greatly facilitated by latex(model) or Function(model). I could write an equation to compute SE of the LP in real time using the full varcov matrix if I could easily convert the b coefficients on the splinevar, splinevar` notation into b* splinevar + b* pmax(splinevar-knot1,0)^3 - b* pmax(splinevar-knot2,0)^3 + b* pmax(splinevar-knot3,0)^3.

Thanks for considering,
Pavel

2 Likes

My colleague at Vanderbilt, Jonathan Schildcrout, has done a lot of work on exactly this problem, approximating the variances using ordinary regression so that approximate confidence intervals can be done with risk calculators. I am asking him if he can add some comments to your excellent question.

Regarding exporting fitted equations to other systems you might explore the R rms package Function function, which creates an R function to evaluate the predictions. The rms package has other functions for translating the R code into SAS or Perl, and it is easy to write other translators.

Now that would be mighty nice - thank you!

It seemed to me a solution would be evaluation of the vcov matrix with the user-input predictor values but splines complicated trying it out. Still feasible, no?

I use latex() and Function() regularly. Haven’t tried translators yet. Maybe when I get this sorted. A general solution would be welcome for community at large.

I was thinking as an approximation of just fitting an ols to the standard errors using the same predictors. But I spent all this time getting better standard errors with multiple imputation (aregImpute) might as well get things as precise as possible :smile:

Transporting the vcov matrix is ideal. Our EHR application didn’t allow for matrices.

I suppose I’m misunderstanding. If I know the vcov matrix, then not possible to write an equation to calculate standard errors from it based on the referenced equation for the standard error of the lp? It’s obviously going to be long and hideous given the number of variances and covariances with all the predictor combinations but suspect possible?

I think this is what the folks who worked on the EuroSCORE are doing here:

Philippe Michel, Sandrine Domecq, Louis Rachid Salmi, François Roques, Samer A.M. Nashef; Reply to Kuss and Börgermann: Confidence intervals for the prediction of mortality in the logistic EuroSCORE, European Journal of Cardio-Thoracic Surgery, Volume 27, Issue 6, 1 June 2005, Pages 1129–1132,

It looks to me that what you want to do is to have an easy way to calculate a predicted value and prediction interval from a logistic regression. It appears above that you are attempting to calculate the lower and upper confidence intervals for each parameter estimate which does not seem to be what you want.

If we are on the log odd scale, and x is the design vector (1 row and p column covariate matrix) for an individual, then the predicted value is given by, x * coef(fit)… or you can you the predict function. If you want to calculate the standard error of this prediction to obtain the prediction intervals then you want: sqrt( x * vcov(fit) * t(x)). This is precisely the ASE of logit§ that you show above but in matrix form. Notice that I am assuming x is a 1 by p matrix. Make sure that the vectors/matrices are conformable.

I hope this helps.

1 Like

It does - thank you!

Still no way to get an equation for this without relying on real time reference to the vcov matrix eh. Looks like it will need a shiny app. I haven’t made one before. Well if you have any tips on doing that I’m all ears!

For anyone reading, this paper is a very introductory tutorial https://www.ncbi.nlm.nih.gov/pmc/articles/PMC5879507/

Jonathan has a way to approximate the variance of the logit to an accuracy > 0.9 by fitting a second regression. He may say more about that.

Yes that would be most welcome!