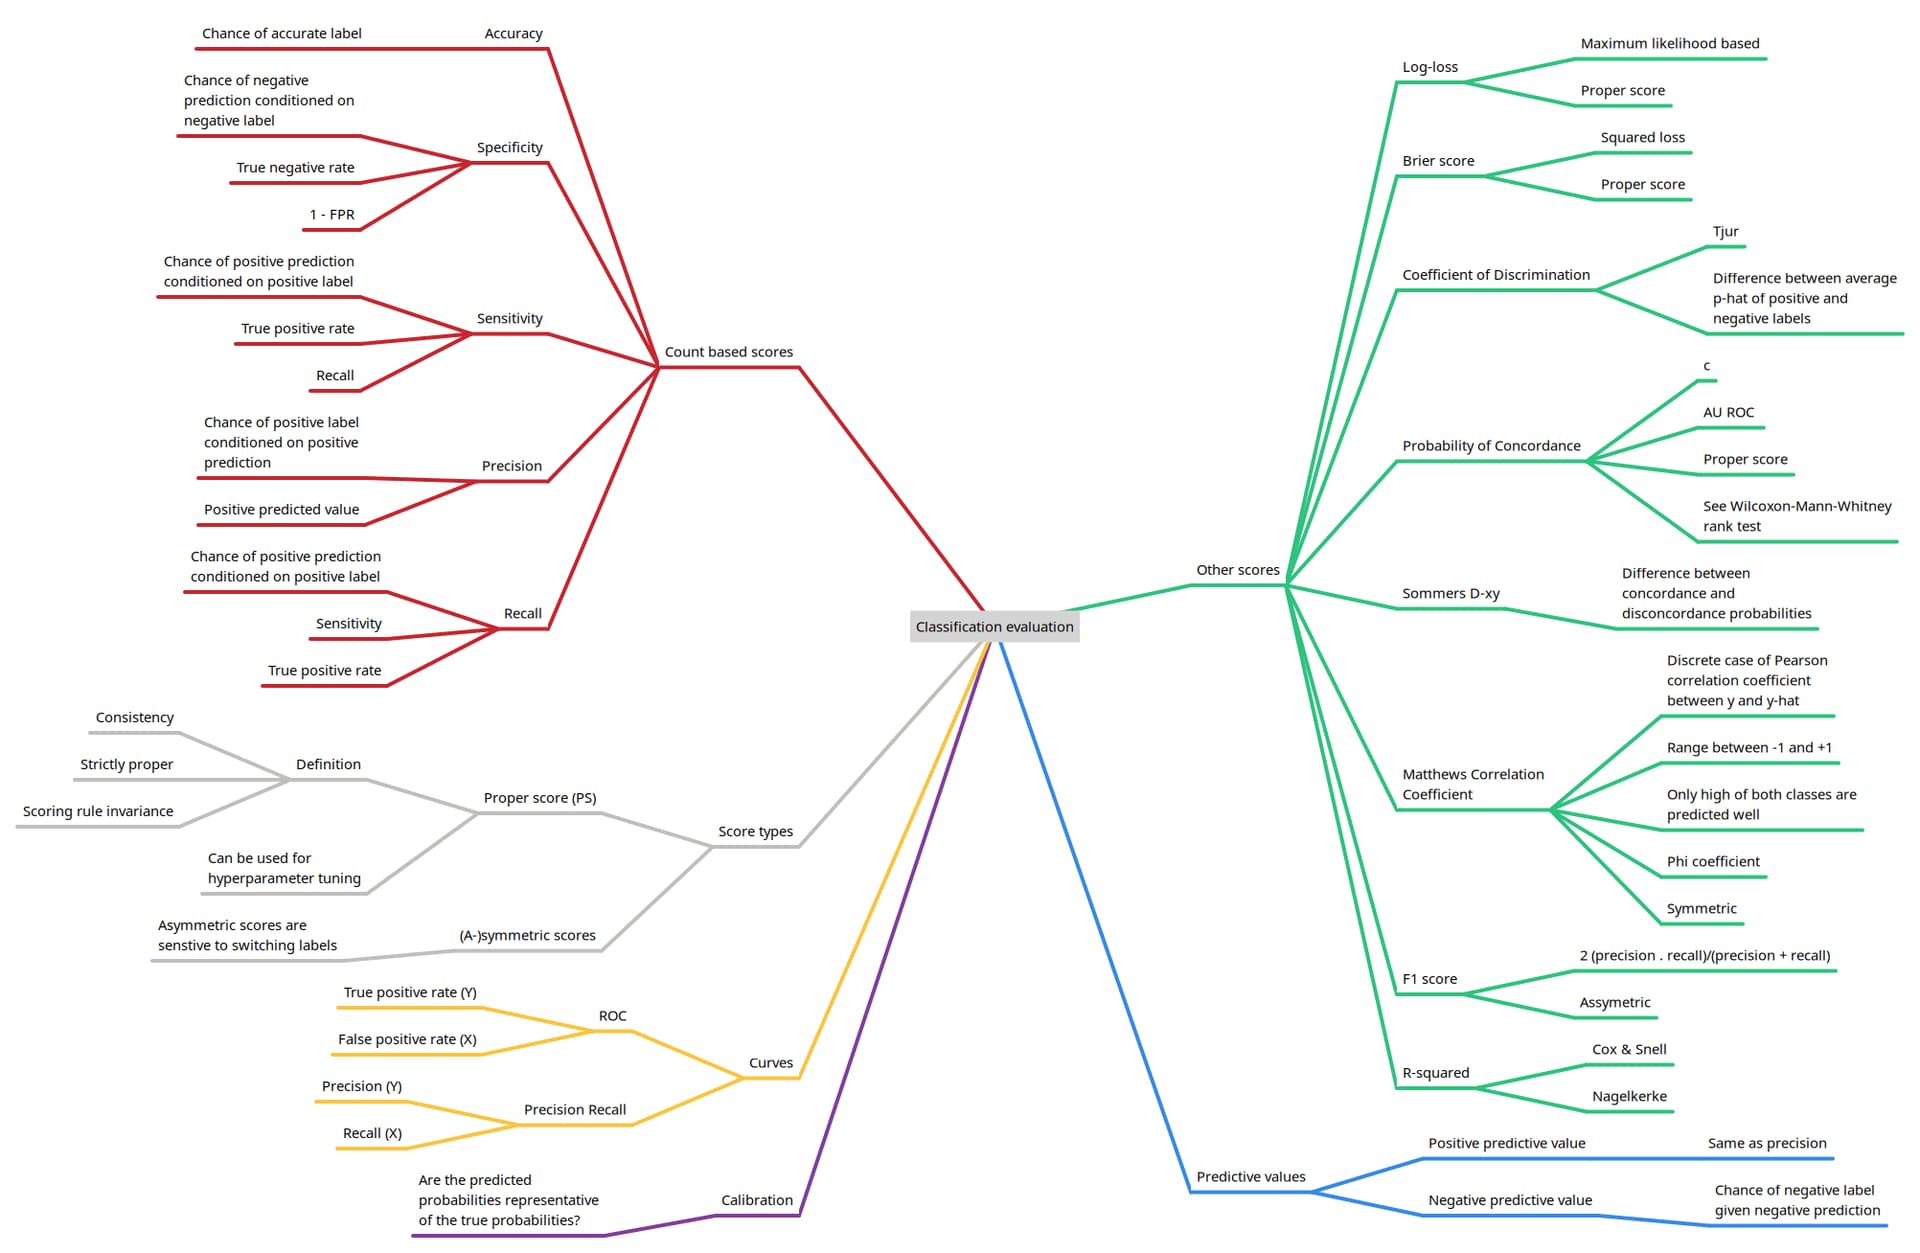
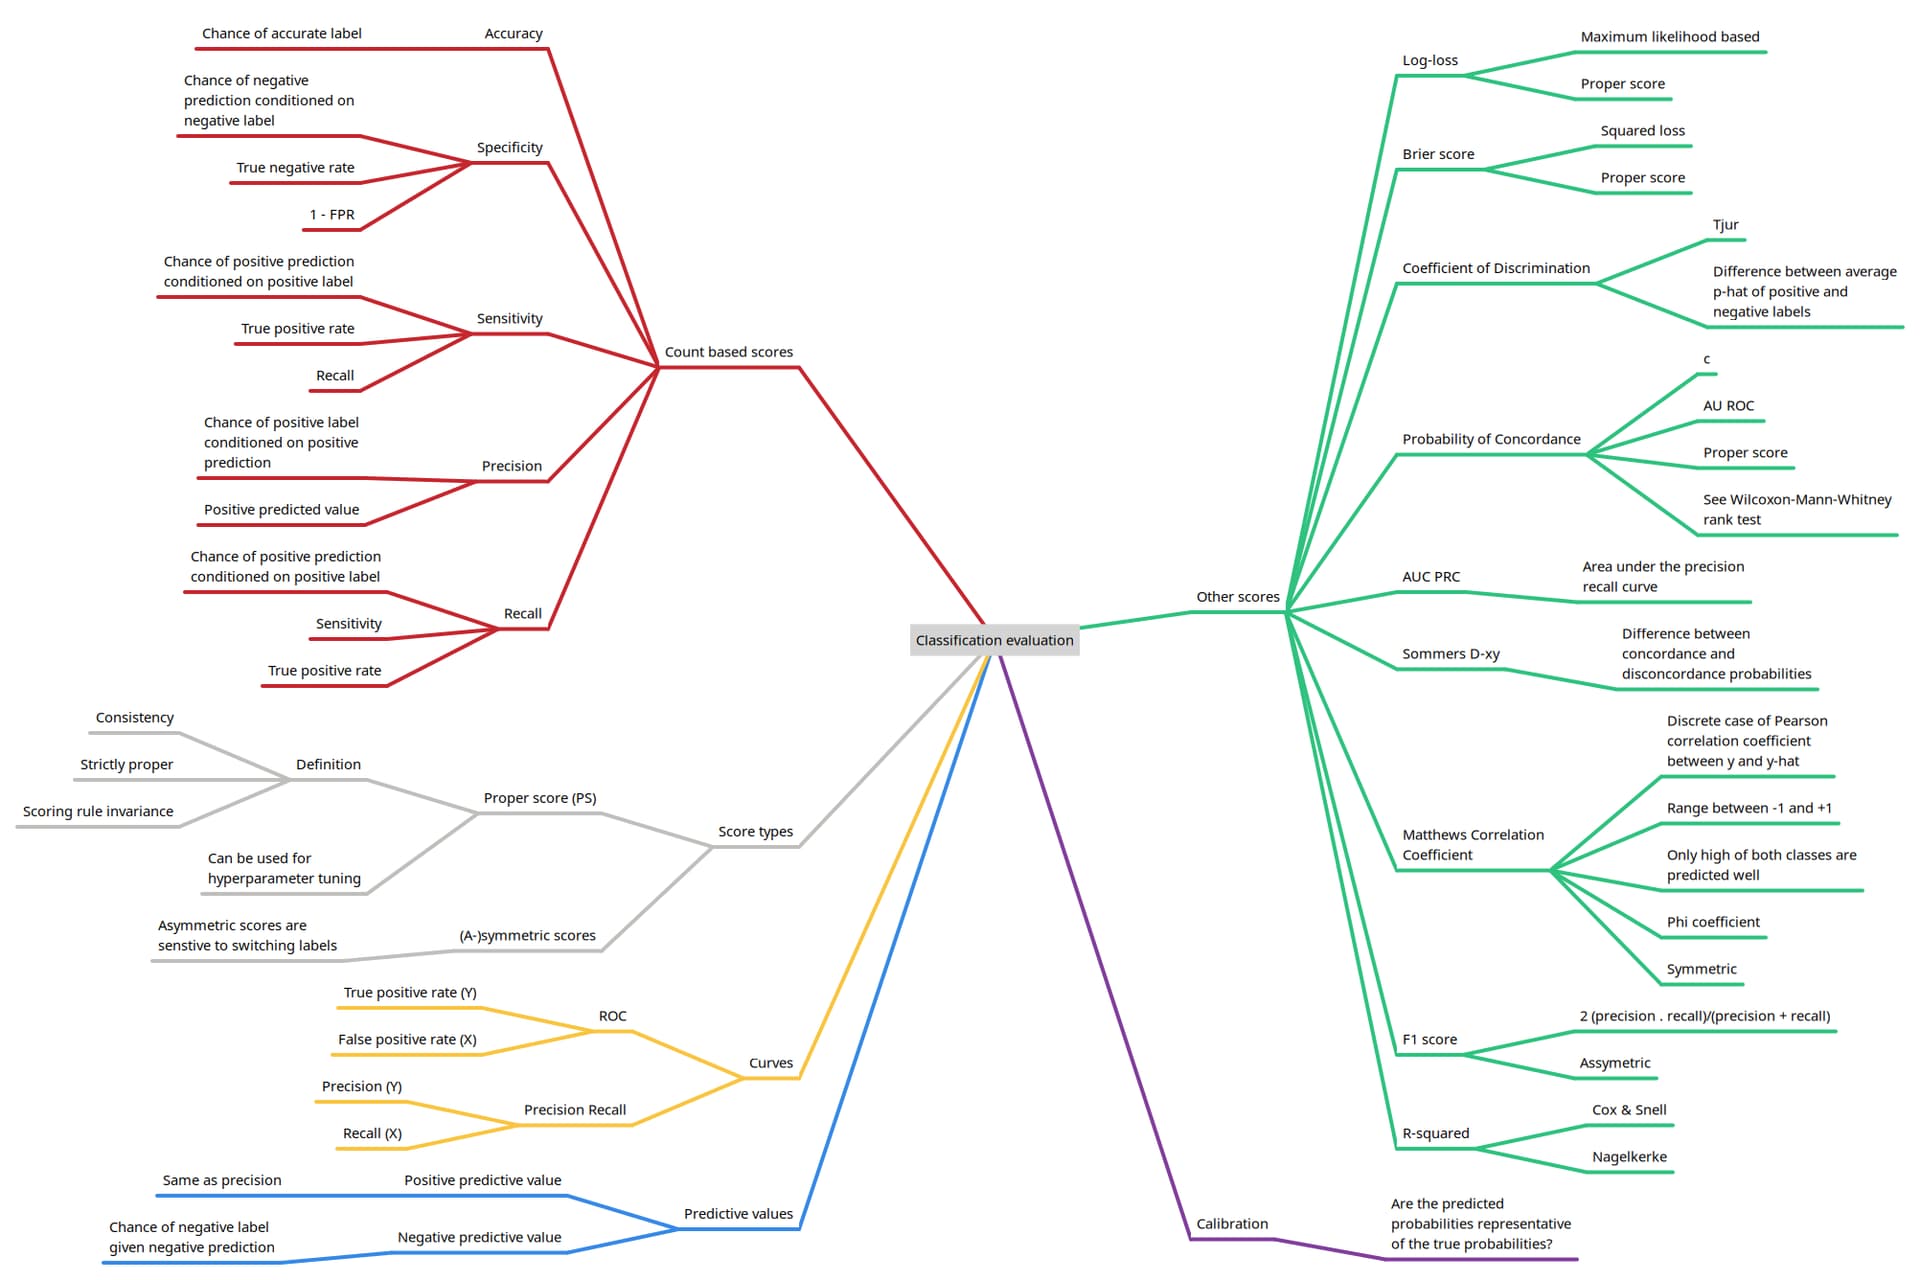
I wanted to evaluate alternatives to AU ROC for classification evaluation and decided to structure my knowledge and findings in an overview. Maybe this is helpful to someone.
It is save to say that this overview will not be permanently stored in my head. If you feel ashamed from time to time for not having all this info readily available, my advise is don’t.
MCC seems like a good contender. I found an interesting article here.
Yes, you make a great point. First of all this article might be badly written. Second, referring to my mind map, in this area things get messy very fast.
From a ML perspective there are heuristics for optimization using AU ROC, AU PRC or MCC. But then not every heuristic is clear, or easily translatable to the problem at hand.
Provided there is enough data, one can take a dataset, optimize for a measure and simply observe notable differences. Create and AUC, but perhaps a different tradeoff curve is more interesting for the problem at hand.
There is a gold standard objective function: the log likelihood function. For Bayesian modeling it is the log likelihood plus the log prior. Keep it simple.
Yes, this might be an ML thing solely. From an ML perspective optimizing for log loss renders different results than for example AU ROC.
From a statistical point of view I also find this awkward. Say a an algorithm has a log loss loss function. For hyper parameters tuning still AU ROC is used. It is like bending the loss function. This is more or less established practice.
Would you have an opinion on this from a statistical/generalisability point of view?
For risk prediction models, it would be simpler to present the population risk distribution and its estimated parameters. This would be an alternative to the classification performance measures in the diagram. (Alternatives to the ROC curve AUC and C-statistic for Risk Prediction Models [2311.08559] Alternatives to the ROC Curve AUC and C-statistic for Risk Prediction Models). If a discrimination measure were desired, the coefficient of discrimination is simpler and more intuitive than the ROC curve AUC and C-statistic and is the same for any probability distribution: SD^2/(mean(1-mean)).
Optimizing the log likelihood is supposed to give different results from optimizing AUROC. AUROC is a bad optimality criterion that does not reward extreme predictions that are correct. It only uses rankings of predictions and not the predictions themselves. It is not sensitive enough, and optimizing it will lead to the wrong model for estimating anything useful.
Yes, so AUROC is highly opaque if you have to translate it to a specific setting.
Checking if I understand you well. You say to first optimize the log likelihood. And then use for example cut-off changes to optimize for the measure that is useful for the case.
Optimize the log-likelihood or the sum of the log-likelihood and the log-prior. Then use the posterior multivariate distribution of all the parameters to optimize a decision. For simple cases you can solve for a cut point in a predicted risk that coincides with the optimal decision. (This has nothing to do with “finding” cut points on input variables by the way.)