I have a validation data set of 29242 patients, with known labels/health outcomes and predictions that were generated by some model. 28626 patients had a negative outcome and 616 had a positive outcome. The overall AUC is 0.7134.
The reviewers asked to divide the validation data into two subsets/subgroups, defined by a pre-existing medical condition, and then to apply the prediction model to each subset separately.
Out of the of 29242 patients, 4832 had this condition and 24410 did not.
The outcome by subgroup split is
        0     1
  0 24080  4546
  1   330   286
When I applied the same prediction model to each subset separately, The AUCs for the subgroups were 0.612 and 0.655. That is, the AUCs of each group separately are smaller than the overall AUC. How is that possible?
One explanation I can think of is that the pre-existing medical condition is an important predictor of the original model (the second highest SHAP value). Another explanation may relate to the balanced outcome withing the subgroup with the medical condition.
What do you think?
Your first explanation is the correct one. And in general when you stratify on an important variable, the within-subset assessment is now for a more difficult discrmination task. Hence the c-index, like R^2, will be smaller.
The reviewer’s request is unreasonable for a variety of reasons. If the subgrouping variable is thought to “mess something up” you should look at interactions with that variable in the context of the over-arching model.
I have a slightly different take on this as follows:
If we consider AUC to be a noncollapsible effect measure akin to the OR then the same rules apply and both strata can be lower or higher or even one lower the other higher.
Thus if the medical condition is a non-confounding prognostic variable for the outcome then both strata will have higher AUCs
If the the medical condition influences both model predictions and the outcome then you can get the results seen - i.e. both strata can have lower values
Finally if there was interaction by the medical condition then again the pattern would differ
Thanks for cataloging this discussion here. I’ve just had the same request as was made of Yossi, and am planning to respond explaining what happens when we look at subgroup analyses where the subgroup is defined by important predictors in the model. I am wondering if either of you are aware of a publication that I could point them to that discusses this topic? Thanks!
There is a straight-line relationship between the ROC curve AUC and the SD for a number of continuous probability distributions (uniform, half-sine, symmetrical triangular, and (for similar SDs) beta distributions)(Interpretation of the Area under the ROC curve for Risk Prediction Models [2102.11053] Interpretation of the Area Under the ROC Curve for Risk Prediction Models), that can be approximated as:
Plugging the numbers provided into this formula and solving for SD (assuming I’ve assigned the AUCs to the correct subgroups) :
number
mean (risk)
AUC
SD
population
29,242
0.0210656=616/29,242
0.7134
0.0157168
condition absent
24,410
0.013519=330/24,410
0.612
0.00533449
condition present
4,832
0.0591887=286/4832
0.655
0.0308258
In the usual situation, where AUCs from different models applied to the same population are compared, the mean risks are the same, so differences in AUC reflect differences in the population SD. But when AUCs from the same prediction model applied to different populations are compared, differences in AUC may reflect differences in their SDs and/or their means. As shown in the table, the subpopulations with and without the condition (a risk factor) differ for both mean risk and SD. It’s not clear why the reviewers have requested these AUCs or how they would interpret the differences.
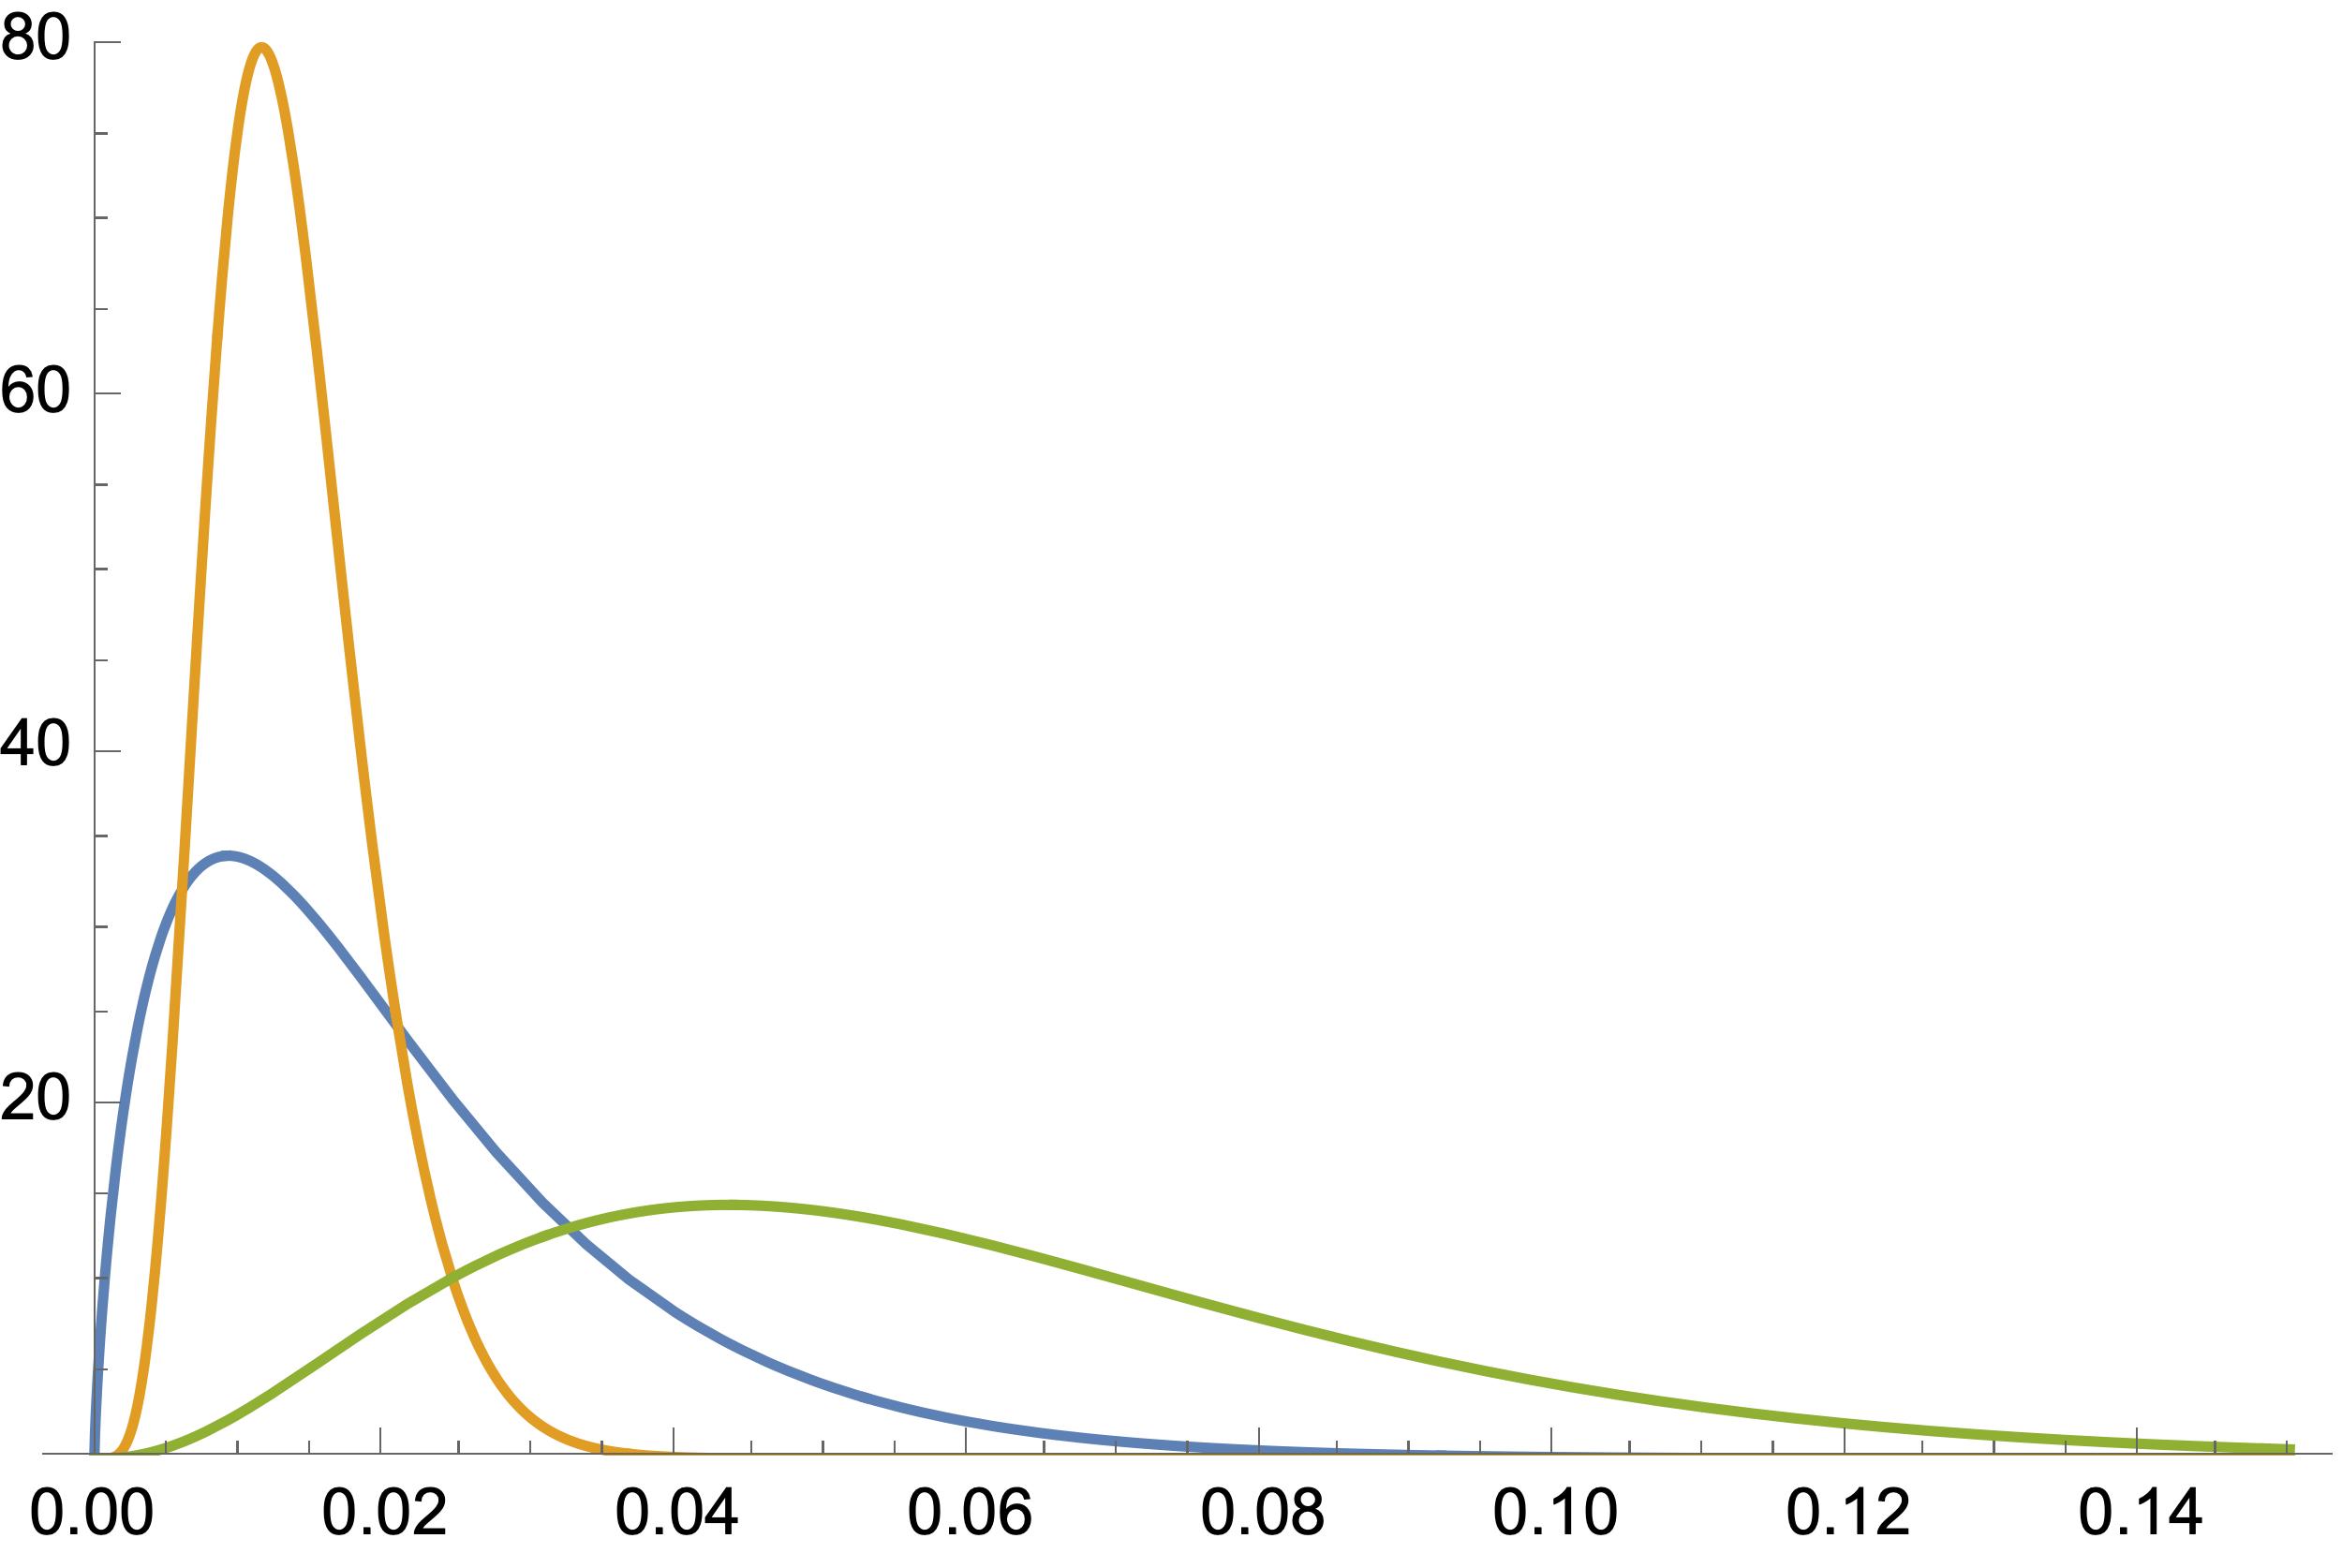
Were all three distributions beta distributions, they would look like this: