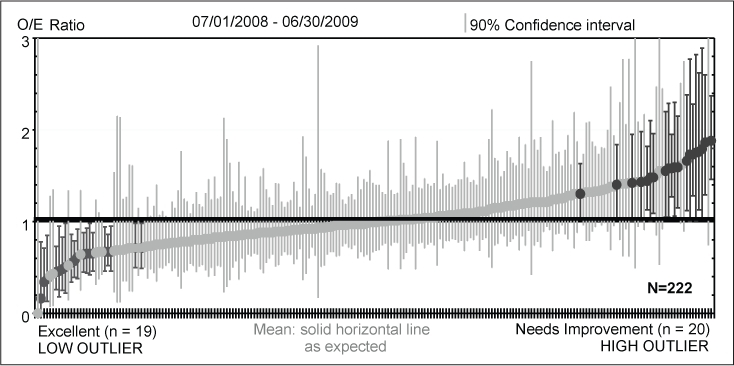
I posted a query on twitter (https://twitter.com/ehlJAMA/status/1831516506699788366) regarding interpretation of clinical quality improvement data. The tweet was a reaction to a statement made in grand rounds talk. The presenter showed a figure like the one attached here and said that hospitals with observed/expected (OE) ratios significantly different from what is expected are outliers in need of improvement.
It occurred to me that graphs like these (which are commonly used today in medical QA) are just a sampling distribution and that being at the tails of the distribution could reflect sampling phenomena or a true quality problem. Referring to a facility with an OE ratio above 2 as an outlier and in need of improvement seems wrong.
In response to my query, one commentator (@AdanBecerraPhD) referred to a 1997 publication demonstrating a Bayesian analytic approach to this type of data (https://t.co/in7g8Um8Cu). It used Bayes techniques to show posterior distributions of outcomes and use these distributions to determine if a hospital has problematic quality or not.
Like so many other aspects of medical research, QA investigators are using out of date statistical methods and using them incorrectly. There is a need to improve the quality improvement movement.
Is anyone aware of recent publications and/or software that can be used to compare facility/practitioner outcomes using Bayes?