This topic is for Q&A and discussions around the BBR chapter on high dimensional data analysis.
1 Like
Greetings Professor. I am following up on the bootstrapping method of feature rankings.
I have 167 metabolites for 37000 participants from the UK Biobank. I want to select metabolites correlated with ultra-processed food intake.
-
First I used elastic net, forcing demographic characteristics in the model and penalizing metabolites. Here, 158 metabolites were selected.
-
I use bootstrap to rank metabolites (I did not include demographic variables). It appears I have like 3 ‘winners’. But I am not sure how to proceed with the two sets of results.
I request you to look at my plots and give an opinion.
Which set of the two approaches is more assuring? How to interprete the plots?
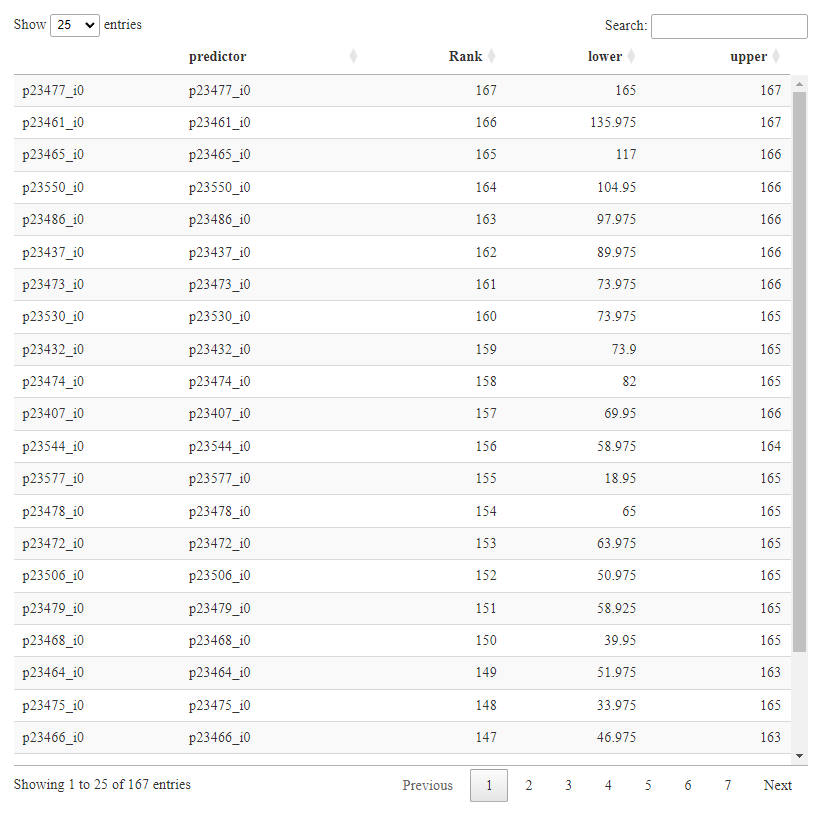
Can your code produce ranks and 95% CI in a table format?
Thank you in advance for your time.

At first glance it appears that the sample size is far too small to be able to select winners reliably. Can you tell us the 0.95 confidence interval for the rank of the winner?
You would have to code a table yourself, but that’s easy to do from the bootstrap result.
I’m glad you are doing this because there are many misleading analyses in the literature where winners were chosen just because they passed a false discovery probability test, with no attempt to validate that non-winners are really losers.
The futility of finding winners by competing raw markers (which may even be collinear, making the analysis even more difficult) is why it’s most often better to ask less specific questions of the data. This is done using data reduction (unsupervised learning) to find common factors, then relating data reduction summary measures to the outcomes to avoid some of the curse of dimensionality.
Thank you Professor for the feed back.
Can you tell us the 0.95 confidence interval for the rank of the winner?
I have attached the table of ranks. The winner is 167 (165-167)
I’m glad you are doing this because there are many misleading analyses in the literature where winners were chosen just because they passed a false discovery probability test, with no attempt to validate that non-winners are really losers.
Thank you for the positive feedback.
To further follow-up on the first question, What is your comment about the elastic net regression results. Elastic net selected 158 metabolites. Of the bootstrap and elastic net results, which ones are more reliable? Is the bootstrap also meant to expose the reliability of elastic net results?
The futility of finding winners by competing raw markers (which may even be collinear, making the analysis even more difficult) is why it’s most often better to ask less specific questions of the data.
Is elastic net not meant to handle the problem of multicollinearity?
I’m surprised that the top winner was always the top winner in every bootstrap rep. It must have an extremely strong correlation with outcome. From the table it appears that you can trust the top 2 winners. But there is little trust that the non-winners are losers. You might look at the bottom end and see how many apparent losers have a most-favorable confidence limit that excludes them from being useful.
Your situation is different from others I’ve dealt with because of the large sample size. I assume the variable being predicted is continuous so that the effective sample size equals the apparent sample size. There is a possibility that all the metabolites are winners. If you bootstrap a unitless index of predictive discrimination such as R^2 to get confidence intervals on R^2 that would give more useful information. For example if true winners have R^2=0.02 nothing matters very much.
Neither lasso nor elastic net handle collinearities well. Some useful analyses would be variable clustering followed by computing the first principal component on each cluster. Or use sparse principal components, which essentially combines these two steps. A redundancy analysis may also shed some light. These methods are exemplified here and here.
I greatly appreciate the guidance
You might look at the bottom end and see how many apparent losers have a most-favorable confidence limit that excludes them from being useful.
Is there any criteria for determining a favorable confidence interval? And after excluding the losers, is it fine to proceed with the rest, for example in clustering or principal components?
I assume the variable being predicted is continuous
Yes.
For example if true winners have =0.02 nothing matters very much.
Thank you for this suggestion. I will try this out and share the output.
“By nothing matters”, do you mean there won’t be an apparent single winner?
Some useful analyses would be variable clustering followed by computing the first principal component on each cluster. Or use sparse principal components , which essentially combines these two steps
I am excited to try out these approaches and share feedback.
Thank you once again Professor f2harrell for dedicating your precious time to guide on this project
1 Like
A quick question about the sparse PCA example from RMS. I can see all variables (demographic and biochemical) were clustered and formed PCs.
Since I plan to adjust for these variables in further analysis using principal components as independent variables, Should I also use all the variables in the data set to form sparse principal components?
Thanks for exploring these methods.
Favorable confidence limit: not specify guide, just look for narrowness.
By “nothing matters” I meant that if you are trying to find winners and the winners only explain a trivial amount of response variable variation, the whole prediction goal is not going to lead to much that is fruitful.
The problem with only modeling “true winners” (e.g. those with least favorable confidence limit still very favorable) is that most of the non-clearly-winning markers are in the gray zone and you have no evidence to exclude them from the model. And also if you use importance measures to select variables you will get overfitting / model uncertainty / inaccurate inference.
1 Like
This is very assuring.
What I understand from your comment is that given the data, it might be very problematic to settle with a handful of winners. Please correct me if I misplaced your comment.
After visiting RMS, I believe that the bootstrap ranking has provided reasonable justification for considering SPCA. I believe my analysis will benefit from clustering methods.
I will implement SPCA and share my results here.
1 Like
Hello Professor.
I have implemented sparse principal components analysis on my data. Metabolites were already transformed and imputed. So I used the following code for implementation:
s ← princmp(d, k=20, method=‘sparse’, sw=TRUE, nvmax=3)
However, I don’t know the basis for specifying k and nvmax.
Also, prior to SPCA , I performed redundancy analysis. Should I exclude redundant variables from SPCA?
The following is my scree plot using all the 165 variables
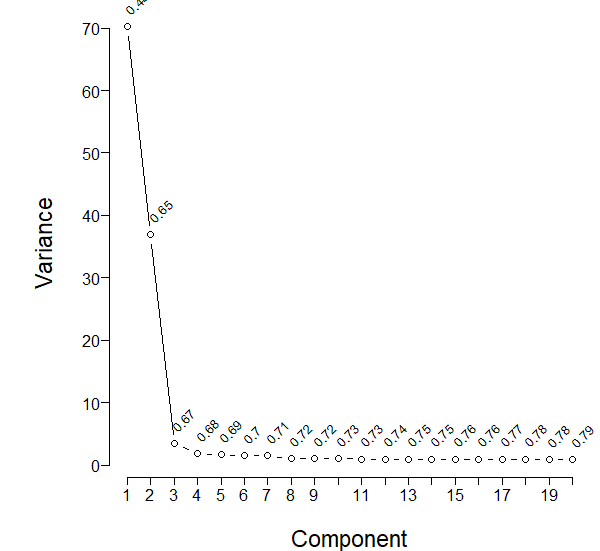
Considering the scree plot, should I proceed with the first 4 components?
I will be grateful for any feedback
I would like to evaluate how well components predict my dependent variable. I adapted the code from RMS and plotted the graph as follows:
I would like some comments on the plots.
Thank you so much
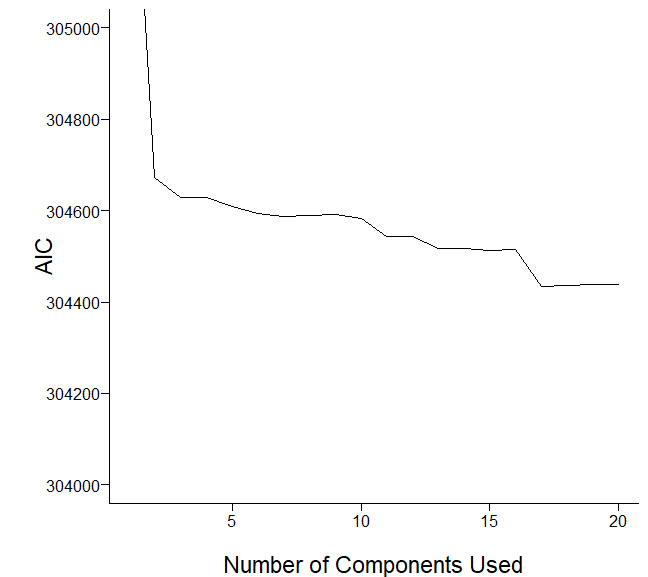
Please edit post to delete the blank graph. k and nvmax are used to limit what is shown so are up to you. Based on the scree and AIC plots I’l pick somewhere between 6 and 20 initial components. Don’t use results of redundancy analysis in PCA.
1 Like