This is a place for questions, answers, and discussion about session 6 of the Biostatistics for Biomedical Research airing 2019-12-06 and dealing with frequentist and Bayesian 2-sample t-tests and how not to present results involving P-values. Session topics are listed here. The video will be in the YouTube BBRcourse Channel
Is information reduction (e.g., hypothesis testing) occasionally justified for the sake of simplicity and communication? Reducing p-values via a threshold p < 0.05 reduces the difficulty of remembering the result at some cost to how true the understanding is. Doesn’t it make sense to evaluate the audience in terms of how simple the results should be. I’m not saying to force a hypothesis testing onto the audience, but potentially to offer it as a starting point for communicating and understanding the results. I’m not necessarily arguing for doing this, but posing it as a point for discussion. As we move away from p < 0.05, how do we keep communication simple in cases that require it? When we have multiple p-values to communicate it can reduce the information to put them into groups (chunking). Chunking requires that we define one or more thresholds, the simplest being p < 0.05 and p >= 0.05. I agree there are issues with this, but think it also helpful to acknowledge what benefits there are so we can discuss how to maintain the benefits as we discard this practice.
Thresholds are destructive in this context.
For suggestions for reporting/interpretation go to https://discourse.datamethods.org/t/language-for-communicating-frequentist-results-about-treatment-effects .
Like racial profiling (I know you’re doing nothing like that) attempts at simplicify backfire.
I would agree for communication of a single treatment effect. What about when you are communicating the results of effects for 20 different groups and your audience is not a scientific audience. You anticipate that the audience is not going to consider the actual p-values, but just interpret your wording of the evidence. You consider using “strong”, “moderate”, “weak” and “no” evidence to supplement p-values. This discretizes into 4 categories of evidence. You anticipate that people are going to stop reading by the end of the paragraph because it is just a long laundry list of effects. You provide a plot with CI for the effects of each group, but anticipate that readers will have difficulty interpreting because they can’t decide whether to focus on the confidence limits or the estimated values. Grouping by magnitude of evidence (against the null or some meaningful value) allows you to shorten the length of the paragraph and the complexity within the paragraph.
Are there any recommendations (or links to discussions) for in text discussion of results with many effects in simple language where if people only have 5 minutes to read that will come away with a basic conception of results?
We definitely need more literature where quick comprehension of various presentations has been tested. A key problem with the approach is that you will find much disagreement from person to person in the value of the thresholds to use. Another key problem is that a finding just below a threshold will have evidence that is more similar to another finding just above the threshold that it is similar to the next item below the threshold. One other thing: you need to have a place in your scheme for “we just don’t know”.
But my dream presentation would be a wide axis title degree of evidence for (whatever) which is a Bayesian posterior probability, and you have dots along this axis. The only non-debatable labels for the 0-1 scaled axis are impossible at zero and certainty at 1.0.
To get an idea of how thresholds have harmed us, consider a high-dimensional case where false discovery probabilities drive the selection of which single nucleotide variants (SNPs) are associated with development of a certain disease, from among 1,000,000 SNP candidates. 1M odds ratios against the disease 0/1 variable are computed, along with 1M p-values. The “winners” are selected by computing a p-value threshold that results in an acceptable fraction of SNPs being falsely selected as associating with disease.
People wonder why such studies to not replicate with other samples. They shouldn’t have to wonder. Bayesian posterior probabilities expose the issue. For each candidate SNP compute the Bayesian posterior probability that the odds ratio with disease is greater than 1.0. Select those SNPs for which this probability exceeds 0.99 and call them “almost definitely associated with disease” and select those for which the probability falls below 0.01 and call them “almost definitely not associated with disease”. You’ll see that the vast majority of SNPs fall in the 0.01-0.99 interval, with many of those in 0.2-0.8. In other words “we just don’t know” and we’re unable to find “winners” and “losers” reliably. To rule out a SNP from future research just because it’s not a “winner” is a mistake—likely a false negative.
So if we are honest in saying “we don’t know” more often we’ll make better decisions, and disappoint readers of our articles who are looking for definite conclusions. The use of thresholds compounds the problem.
3 Likes
Thresholds can be harmful - agreed. They are arbitrary, give the impression of certainty and cause issues with replication.
The issue for discussion is communication. It seems that communicating both an estimated model and uncertainty makes communication more difficult. It does this because decisions are more difficult to make when information is uncertain. If we communicate certainty, then decisions are easier. If we communicate uncertainty, then the computations necessary to make decisions are statistical rather than deterministic in nature.
The decision to embrace and communicate uncertainty puts the difficult burden of integrating uncertainty into decision making to the reader/reviewer of the information. Unfortunately, this is a task they are very frequently ill equipped to handle.
On the other hand, if the statistician tries to make the decisions (via hypothesis testing or other method) for the reader/reviewer, the decision will likely be suboptimal because the statistician frequently does not have the cost/benefit information for all interested parties (e.g., to properly balance false positive / false negative rates).
I agree with Bayesian posterior probabilities being the most useful tool for decisions. When we do not know exactly what decisions are going to be made, it would make sense to have either a continuous plot of the Bayesian posterior probability (of being larger than a certain effect size), with the x-axis being effect size. My only concern with this is information overload when there are a large number of effects.
Confidence intervals or credible intervals for a single alpha value reduce the information load, but are too discrete for good decision making when the cost function is continuous in the effect size (which I would imagine is typically the case).
To me the question would be how to simplify the posterior plot without getting too discrete. It seems like the simplest solution would be to divide up the scale of the effect size into a few regions (e.g., small, moderate, large) and report posterior probabilities for each. In dividing up the effect size scale, you would want to balance a) the benefit of simplicity with fewer divisions and b) the cost of approximation from fewer divisions. This reminds me of your discussion of the issues with discretizing outcomes, where for a small number of divisions there is a substantial reduction in accuracy, but for larger numbers of divisions the reduction in accuracy is not that much.
The second step would be to divide up posterior probabilities into small, moderate, and large, again being smart about the number of divisions and where to divide. Finally, based off of categorization of posterior probability and effect size, the effects could be grouped for a simpler/quicker interpretation of the results that still respects the uncertainty.
E.g., effects A, B, C showed small posterior probabilities at moderate and large effect sizes. Effects D, E, showed moderate probabilities at either moderate or large effect sizes. Effects F, G showed large probabilities at large effect sizes.
I guess my main point here is that I am arguing that grouping and discretization is BOTH good and bad. Maybe we should not completely write it off and say DO NOT discretize, but rather be smarter about when and how we discretize. Offer a discretization when you expect that decision makers are going to have to integrate multiple sources of information in with your results to make a decision, and need a way to hold your results in their working memory while they make the decision. Limit the degree of discretization and be smart about the cuts that are made.
I like what you wrote until you got to these points. Not only are these unnecessary, but they will hurt decision making and give a false sense of certainty. Then there’s the fact that you won’t get agreement on how the intervals are to be defined. Discretization before the decision point is a mistake IMHO.
Avoidance of uncertainty only leads to suboptimal decisions and a failure to revisit decisions once they are made.
If one wanted to avoid Bayesian methods at all costs, then presenting the p-value and compatibility interval (aka confidence interval) while de-emphasizing the point estimate, and letting the decision maker use these for decision making, is recommended. What the frequentist statistician should spend her time doing in that case is explaining the various statistical ramifications of making decisions on their basis.
I’m in agreement with you on Bayesian methods.
A few questions:
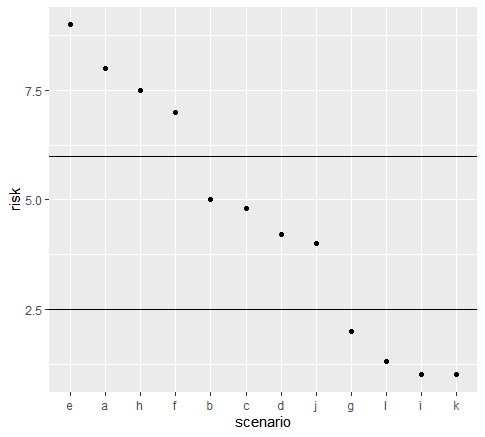
First question. Consider the plot below. For the average person would you consider that it is equally difficult to remember 1) the order of scenarios in terms of their risk, and 2) that HEAF are estimated to have high risk, DJCB are estimated to have medium risk and GLIK are estimated to low risk.
If not we may disagree on whether discretization is a way to approximately remember results. If so then we would agree that discretization is a tool to approximately remember results.
Next question. Do you think the average person always fully remembers results (such as the ordering of all scenarios in the plot) after reading a publication or report when they go about making decisions? I would suggest that they remember some simplification (or don’t remember anything at all). Is it our role to consider what they will likely remember?
Final question. If we offer some simplification (approximation) of the results. Would they be more likely to remember something as opposed to nothing?
So I get your point about avoidance of uncertainty leads to suboptimal decision making. I’m not suggesting not reporting uncertainties. I’m suggesting offering a simplification/grouping of results to help remember the main points. This absolutely could be dangerous (people forget the discussion you gave to uncertainty; people make use of a suboptimal discretization), but also considering if there is merit to doing this in any situation (e.g., explaining results to a child).
I am wondering if there is a balance between a) simplification of results and b) egregious miscommunication / misinterpretation of results?
Your premise is incorrect. Think of baseball. Are batting averages categorized?
Great discussion on this Frank, thanks for your very helpful thoughts.
Not sure if this is what you were saying, but it isn’t the statistician’s job to decide what way of looking at the results is going to be the most helpful for remembering them. If it is important enough, the results will be remembered in full. Same goes for decision making. If you don’t have the cost function, it is not your job to guess at it.
I was suggesting that categorizing could help with memory, but I think you are suggesting that is where the premise is wrong?
How human memory works is not the key point here, although I question that arbitrary categorization helps memory in a helpful way. The statistician’s job is not to create something that can be optimally remembered. It is to create something that optimally represents what we know about the underlying reality. The incorrect (IMHO) premise is that categorization is really needed here. If it were, people would just have remembered categories of batting averages and not player’s individual batting averages.
Thanks for the lecture. I really enjoy the part where you explained that a Bayesian t-test can be ‘repurposed’ to answer different questions (e.g. equivalence).
Is there any practice problems that accompany this course? Or perhaps from other course that may supplement our learning experience?
There are no practice problems per se but in several parts of the early part of the notes, plus the upcoming chapter on linear regression, you’ll see references to The Analysis of Biological Data 2nd Edition. This book has a lot of good exercises, though not ones about Bayes.
Dear @f2harrell, I am trying to access a website you mentioned on page “6-32” here: http://hbiostat.org/doc/bbr.pdf
You wrote: “James Rae and Nils Reimer have written a nice tutorial on using the R brms package for binary logistic regression available at bit.ly/brms-lrm”. Unfortunately, the bit.ly link leads to a sketchy website, not sure why.
Could you please share the original link of this tutorial? Thanks.
James Rae’s blog jamesrrae.com has disappeared and I can’t find this tutorial anywhere. Sorry about that.
2 Likes