The ESC guidelines for the management of chronic coronary syndrome recommend a sequential testing strategy for patients with suspected coronary artery disease and stable angina pectoris.
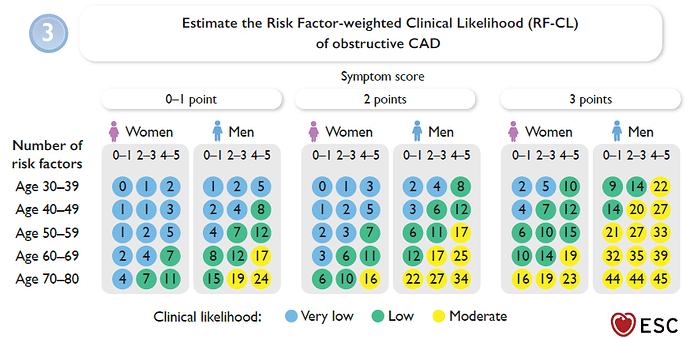
Based on age, sex, symptoms (non-anginal chest pain, atypical angina, or typical angina), and the number of cardiovascular risk factors, a pre-test probability is first estimated using a regression equation or a chart (see screenshot #1).
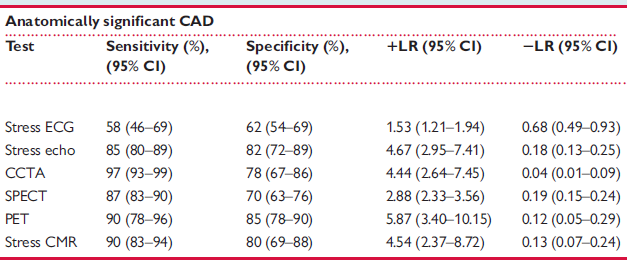
Several studies have evaluated the diagnostic accuracy of different non-invasive imaging modalities for detecting obstructive CAD. In these studies, the single Method was compared to the gold standard of invasive coronary angiography, and the positive and negative likelihood ratios (LR+ and LR–) were calculated.
A meta-analysis by Knuuti et al. (Eur Heart J. 2018 Sep 14;39(35):3322-3330.) summarized these studies and published the corresponding LR+ and LR– values (see screenshot #2).
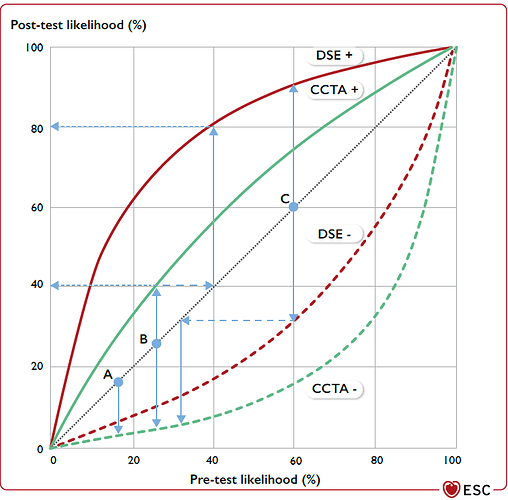
The guidelines now recommend calculating the post-test probability from the pre-test probability by multiplying the pre-test odds by the relevant LR, as shown in screenshot #3.
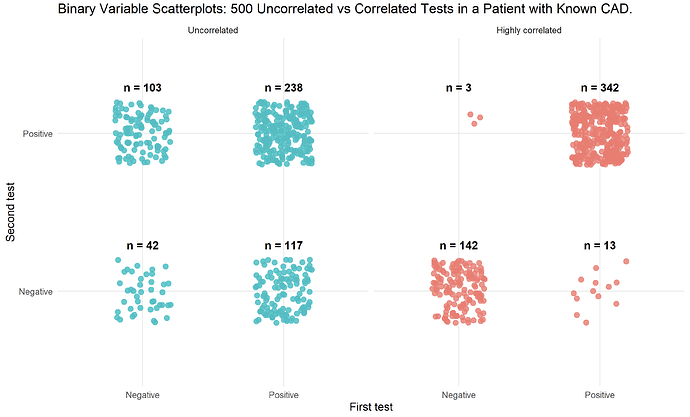
I have read that this approach is only valid if the tests are independent of each other, and that otherwise the post-test probability may be “overestimated”. Is this correct? If so, what exactly does “independent” mean in this context?
If the tests are not independent, are there statistical methods or corrections that can be applied to adjust for the correlation between test results?
Both the regression model for pre-test probability and the published likelihood ratios provide point estimates with 95% confidence intervals. How can the uncertainty of the post-test probability be calculated or represented after applying two diagnostic tests?


