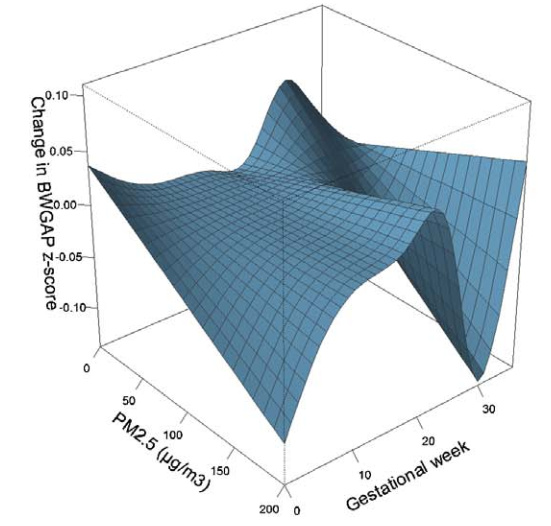
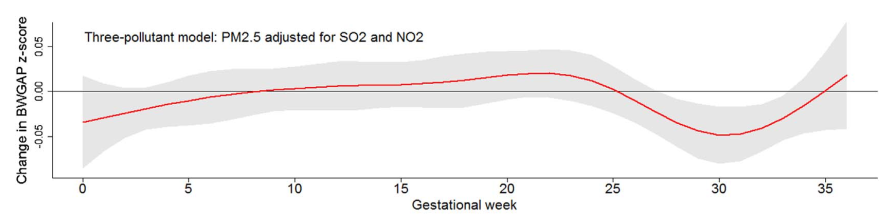
I would like to know if ‘rms’ package can generate a plot of slices in the 3-D surface cut along specific dimensions, like a package named ‘dlnm’ which was developed by Prof. Gasparrini to build distributed lag linear and non-linear models. For example, in a previous paper of mine, I got a 3-D plot (Figure 1, the reference value was 54.2 μg/m3) to show the effect of maternal PM2.5 exposure during different gestational weeks on birth weight for gender-, gestational age-, and parity-specific standard score (BWGAP z-score). I can set the PM2.5 value to 109.6 μg/m3 and then I can obtain a slice plot (Figure 2) from the 3-D plot to show how the effects of maternal PM2.5 exposure on BWGAP z-score vary in different gestational weeks when a mother lives in an environment with a constant PM2.5 exposure level of 109.6 μg/m3, compared with another mother who lives in an environment with a constant PM2.5 exposure level of 54.2 μg/m3.
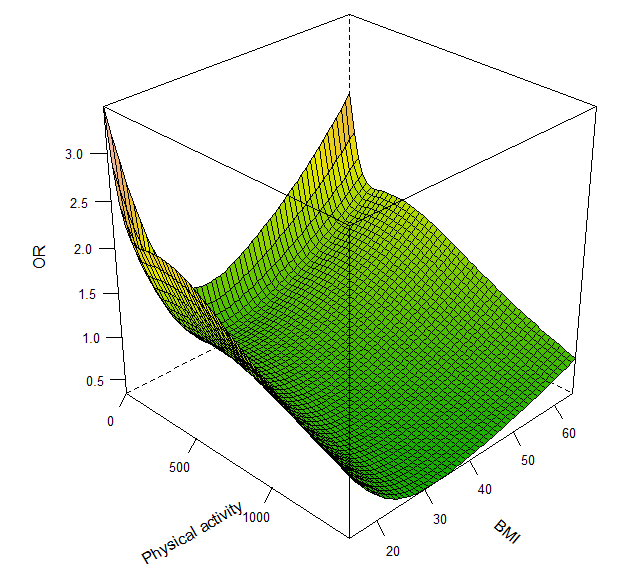
So, if I have a 3-D plot (Figure 3) presenting the effect of physical activity duration time and BMI on CVD mortality, how can I get a slice plot to show the relationship between BMI and CVD mortality when a people have a physical activity duration time of 500 min/week as an example?
dd <- datadist(bpdata)
options(datadist='dd')
fit <- lrm(outcome ~ rcs(pa_time,4) + rcs(bmi,4) + SEX + AGE, x=TRUE, y=TRUE , data=bpdata)
p <- Predict(fit, fun=exp, pa_time, bmi, np=50, ref.zero=TRUE)
bplot(p, lfun=wireframe ,drape=TRUE, col.regions=terrain.colors(600), xlab="Physical activity", ylab="BMI", zlab="OR", screen=list(z = -45, x = -60))