Hi, oncology fellow here trying to understand censoring in survival analysis. Any help from the stat gurus here would be much appreciated.
I’m reading this article looking at a drug combination progress free survival (PFS). There was a comment saying:
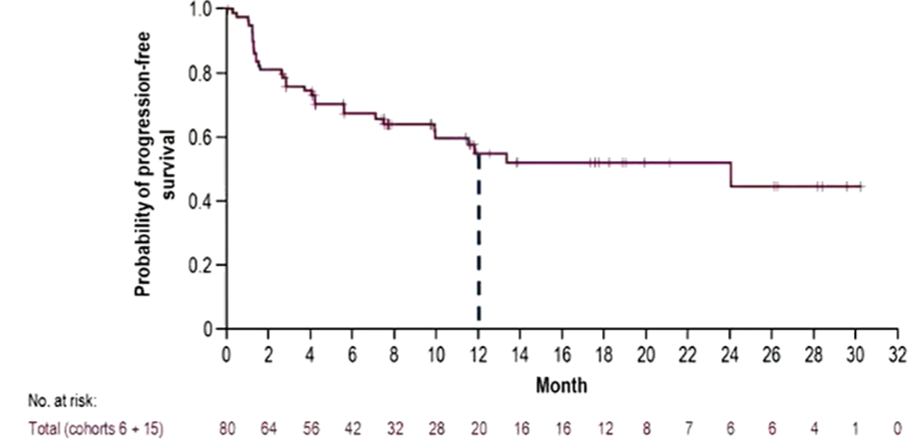
Regeneron also provided an analysis estimating that median progression-free survival was 24 months, seemingly far superior to the 10.1 months in Opdualag’s label. However, caution must be used here: the survival curve for fianlimab plus Libtayo is heavily censored, and with just a few more early events the median could easily halve.
Article here if interested: Esmo 2022 – Regeneron stakes its Lag3 claim | Evaluate
I hope to understand what does it mean by survival curve being heavily censored, and how did it not account for early events. They are saying because this survival curve is heavily censored, the median PFS may be over-estimated and therefore the numerically higher median PFS compared to another clinical trial may not be clinically significant. But I am having difficulty conceptualizing this - any help would be greatly appreciated. Thank you all very much.
you wouldn’t say the estimated median doesn’t account for early events; it seems they are just speculating on the impact such events would have on the estimated median if they had been seen. Reporting the confidence interval would be a better way to make the point. I wouldn’t say PFS is heavily censored (the median is at least estimable, ie the censoring rate <50% - it is just the proportion without an event). More important might be when and why censoring is occurring. If there is early censoring it is worth wondering what explains it
I hope to understand what does it mean by survival curve being heavily censored, and how did it not account for early events.
Survival (where we are interested in time-to-event, not just a count of events) is a tricky outcome because loss to follow-up makes it difficult to estimate. Survival analysis is a set of techniques developed to deal with this problem. “Censored” means “last seen alive at this timepoint” and the censored individuals on your curve are shown with the tickmarks.
The survival probability is calculated cumulatively; censored individuals remain in the denominator for calculating the risk of an event up until the point where they were last known to be alive. After that time, they drop out of the analysis. Only events cause the survival curve to drop but censoring will cause a larger drop for the next event because it reduces the number of people known to be alive when that next event occurs. This is why Kaplan-Meier survival curves (which is what your posted plot is) get increasingly ‘steppy’ and unreliable as the number “at risk” reduces over time.
If censoring is not informative, this should provide a reasonably unbiased estimate of the survival curve. But censoring might be informative. That is, people who are lost to follow-up early may be systematically different from those with longer follow-up. Very high censoring early on might indicate some kind of problem and will reduce the effective sample size (and thus the reliability of the curve) compared to more complete follow-up.
They are saying because this survival curve is heavily censored, the median PFS may be over-estimated and therefore the numerically higher median PFS compared to another clinical trial may not be clinically significant.
A lot of early censoring might over- or under-estimate the PFS or it might be unaffected (apart from the extra uncertainty due to bigger steps in the curve). It depends entirely on whether the censoring is independent of the outcome, or not. And if it is not independent, whether early loss to follow-up was associated with a good or a bad prognosis.
There’s not a whole lot of point worrying about this particular claim. You can’t (and shouldn’t) compare treatments between two single arm trials. We use RCTs with much larger sample sizes than this to compare treatments. These are tiny phase II studies which were never designed to produce reliable evidence about the (absolute or relative) effectiveness of the treatments, only to find clues about whether they might plausibly (profitably) be worth investigating in larger phase III trials. Shareholders can kid themselves that it’s useful information but you shouldn’t.
If you want to understand more about survival analysis, this text book is very accessible and originates with a cancer trials unit so you’ll probably find the examples easy to follow: Survival Analysis: A Practical Approach.