Confidence intervals for simultaneous inter- and intrarater ICC

I would like to compare two repeated-measures experiments to test whether the change in conditions resulted in a significant (at say alpha .05) change in either/both inter- and intra-rater reliability.

Fortunately this experiment only had two repetitions of measurement by two observers. However, the outcome is categorical, which seems to preclude Bland-Altman visualization and limits of agreement testing.

I imagine that the most accurate approach to simultaneously determine both inter- and intra-rater ICCs in this setting is that detailed by Eliasziw et al. 25 years ago:

Eliasziw M, Young SL, Woodbury MG, Fryday-Field K. Statistical methodology for the concurrent assessment of interrater and intrarater reliability: using goniometric measurements as an example. Physical therapy. 1994 Aug 1;74(8):777-88.

https://www.researchgate.net/profile/M_Gail_Woodbury/publication/15150813_Statistical_Methodology_for_the_Concurrent_Assessment_of_Interrater_and_Intrarater_Reliability_Using_Goniometric_Measurements_as_an_Example/links/0fcfd510bd1a5b6e34000000/Statistical-Methodology-for-the-Concurrent-Assessment-of-Interrater-and-Intrarater-Reliability-Using-Goniometric-Measurements-as-an-Example.pdf

Fortunately CRAN has implemented this in the relInterIntra function (relInterIntra source code) in the IRR package (documentation p 26-27 here).

To compare my two experiments say for statistically significant difference of the intrarater reliability, I would check that there is distance from the upper bound of the first to lower bound of second experiment at the designated two-tailed alpha level.

However, neither the paper by Eliasziw and colleauges nor the IRR package considered the case of calculating the UPPER confidence limit. Instead, a one-tailed test is used to find the lower limit:

image

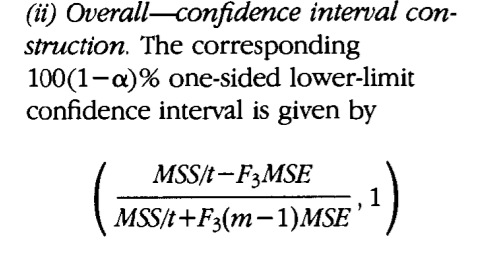
where t is the number of observers, n is the number of subjects, m is the number of repetitions, and F3 is the 100(1 -alpha)th percentile point of the F distribution on
(n - 1) and n (m- 1) degrees of freedom.

I assume there is no convenient R package to get the two-sided limits in the simultaneous intra- and inter-rater ICC calculation setting. Therefore, I am thinking to go to the equation I have pasted above, and tweak it such that:

  1. lower bound: F3 uses alpha replaced by alpha/2 to get the two-sided CIs: 100(1 -alpha/2)th percentile
  2. upper bound: same equation is used but F3 becomes the 100(alpha/2)th percentile

A concern with the above approach is that these steps provide the full confidence interval for the ICC from each experiment individually. To compare the hypothesis of difference in the ICC between two experiments, I think the alpha for the confidence intervals in reality may need to be drawn LARGER than the desired hypohthesis alpha. For an alpha .05 Goldstein and Harvey argued for using z-score of 1.39 to draw CIs for graphical testing, rather than the traditional two-tailed 1.96:

Goldstein H, Healy MJ. The graphical presentation of a collection of means. Journal of the Royal Statistical Society: Series A (Statistics in Society). 1995 Jan;158(1):175-7.
https://rss.onlinelibrary.wiley.com/doi/abs/10.2307/2983411

We would also like to report the corresponding inter- and intra-rater standard errors of the measurement (SEM), but Eliasziw’s paper did not outline any sort of method for determining CIs on that.

Any other suggestions as to simultaneous comparisons of inter and intra-rater ICCs and SEMs across multiple experiments would be very welcome.

If your outcome is categorical, then it sounds to me like you want to be using Cohen’s kappa instead of the ICC. And they come with both upper and lower bounds on their CIs using psych::cohen.kappa.

Regarding your concern about comparing groups, both of which have confidence intervals, maybe I’m being naive, but I would simply compare Method 1 to Method 2, or Method 2 to Method 1. This way, you examine the overlap of the CI with the point estimate of the mean of the other. This doesn’t give you a p value: just whether or not to reject H0.

Actually, on second thoughts, you could run a permutation test (or a bootstrap) to compare (this is probably the better approach). First, calculate the difference in ICCs between the two approaches using the real data. Then randomly shuffle the individuals between the two methods and calculate ICC values for each permutation to create a null distribution. The p value of the true difference is the proportion of ICC differences with the shuffled identities which are more extreme than the difference observed in your true data.

Thank you for your thoughts! Goldstein’s paper cited above outlines the issues with simply comparing overlapping CIs to reject H0 when comparing two methods – too conservative. But comparing Method 2 against the point estimate of Method 1 as if though it were fixed is attractive albeit too liberal b/c it fails to take the uncertainty of Method 1’s point estimate into account.

I’m not experienced enough to really follow the theoretical underpinning of the permutation bootstrapping approach but would appreciate if there is a basic tutorial you could point me to for that.

I also mispoke – our data is not categorical but ordered categorical . Raters were actually given a continuous scale from 0-2 but fixated on whole and half-steps, resulting in 5 ordered choices (which must be a common problem when evaluations are given with numerical scales, e.g. olympic gymnastics judging). I am reluctant to use Cohen’s kappa, due to the loss of our important information on ordering. There is of course the weighted counterpart of Cohen’s kappa. However, in addition to Eliasziw’s nice theory of simultaneous intra- and inter-rater reliability caluclations, the other reason I elected to stick with ICC versus weighted Kappa was Cohen and Fleiss’s discussion :

Fleiss JL, Cohen J. The equivalence of weighted kappa and the intraclass correlation coefficient as measures of reliability. Educational and psychological measurement. 1973 Oct;33(3):613-9.
https://journals.sagepub.com/doi/pdf/10.1177/001316447303300309

Apologies that this is coming so late. I actually needed to do something like this the other day, and thought I’d update here.

Firstly, you’re absolutely right about not comparing the confidence intervals. I was 100% wrong there. However, if the lower bound of the higher 95% CI doesn’t overlap with the upper bound of the upper bound of the lower 95% CI, then I think you will be assured a significant difference. But this is still a bit too hand-wavey.

For comparing reliability coefficients between groups, both CIs are skewed, so the sampling distribution of the difference is weird. I suggested maybe using a permutation test above, but this actually doesn’t work. In a permutation test, you’d randomly switch around the labels and see how they compared to the specific set of data you have. But this really doesn’t work for reliability coefficients because the variance term is extremely important: if one group has higher values than the other, then you artificially inflate the variance too and this messes you around.

So, case-resampling bootstrap comparisons are the way to go. This also has the advantage that whichever measure you end up using (Cohen’s kappa, ICC, or some other outcome), it should work. I had two groups (let’s say Group A with n=50 and B with n=50) and wanted to compare the reliability of my measure in both groups. I sampled individuals (not measurements: we want to sample individuals from each group including both their test and retest measurements) from both groups with replacement (i.e. we will sample some individuals multiple times in each sample) so that we have, say 1000, samples of each group where each sample is the same size as the original group. So we take 1000 samples of the 50 individuals from Group A with replacement; and then we do the same for Group B.

Then you calculate the reliability coefficient (or whatever you’re calculating) in all of the bootstrap samples: all 1000 in Group A and all 1000 in Group B. Then for each index, you calculate the difference between the estimated parameter. So for bootstrap sample 1, ICC for group A = 0.8, and ICC for bootstrap sample 1 of group B, the ICC is 0.9. So the Group A - Group B difference is -0.1. We do this for all of our bootstrap samples. And we’ve now created the sampling distribution for the difference. So if you run quantile(boostrap_differences, c(0.025, 0.975)), you get the 95% CI for the bootstrap distribution.

So, if you find some kind of measure for reliability in ordinal samples (e.g. psychometrics - Inter-rater reliability for ordinal or interval data - Cross Validated or https://scholarworks.umass.edu/cgi/viewcontent.cgi?article=1247&context=pare), you can then just bootstrap the difference! Works a charm :).

Hope this is helpful! Sorry it’s coming so late!