Decision Analysis in Clinical Guidelines: Net Benefit, NNT, & NRI

I am a clinician trying to understand the methodological framework behind recent cardiovascular prevention guidelines, specifically the 2026 AHA/ACC Lipid Guidelines and the accompanying AHA Scientific Statement on Clinical Utility.

I have been trying to reconcile how treatment thresholds are set and how new markers are justified for reclassification. I would appreciate the community’s insight on three specific areas:

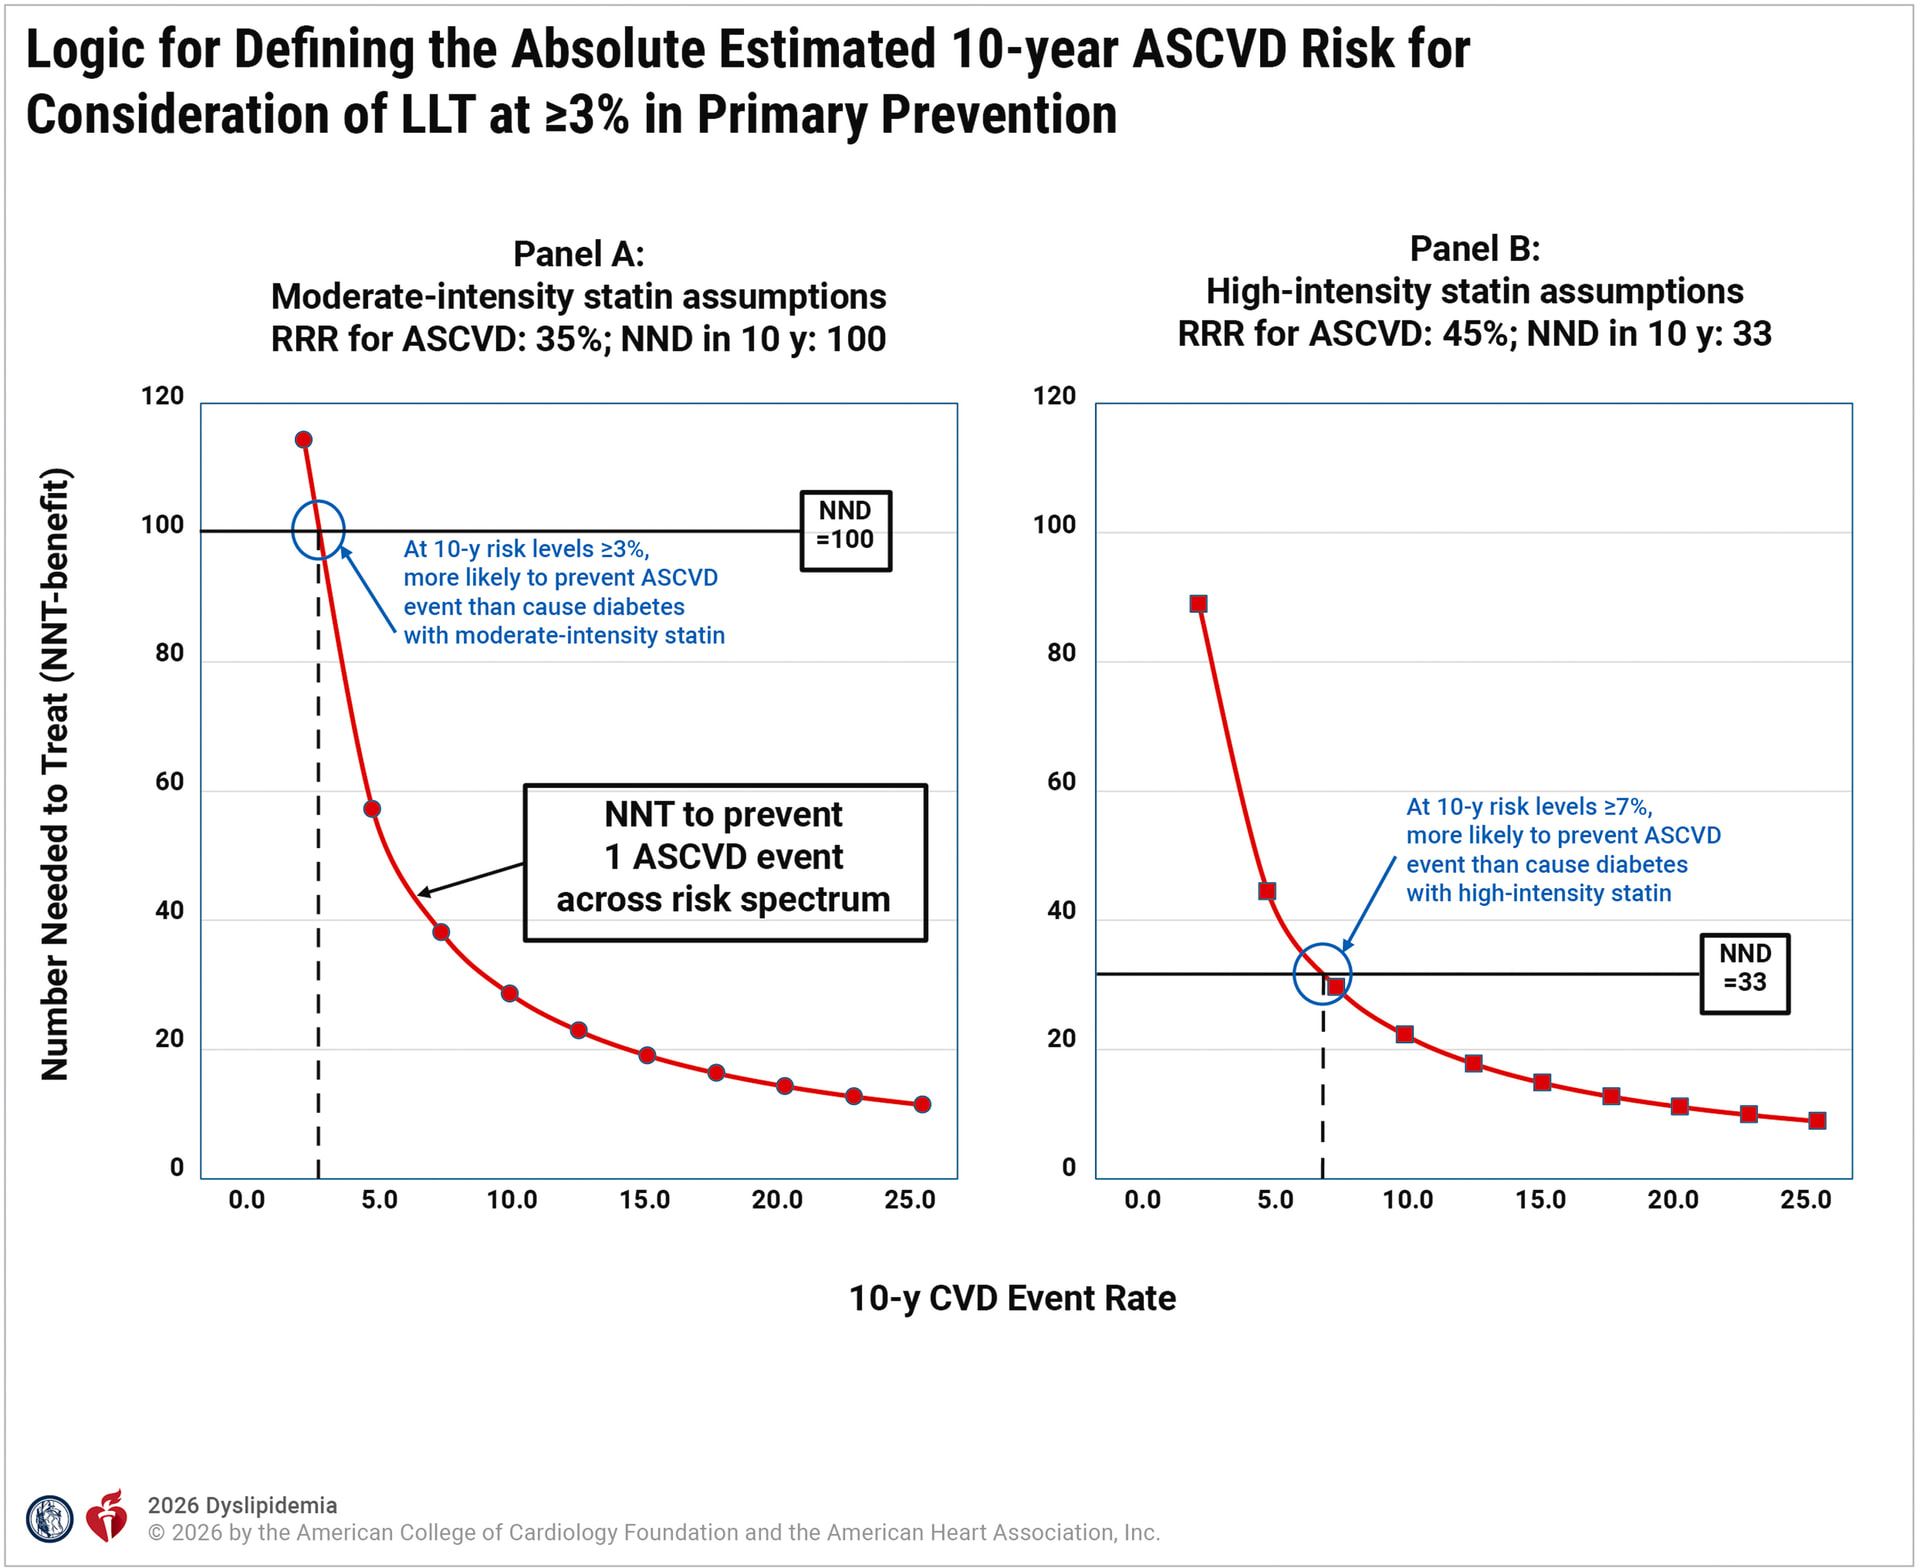
1. On the use of NNT-based Net Benefit to set thresholds

The guidelines often utilize the Number Needed to Treat (NNT) to conduct a form of net benefit analysis to determine treatment thresholds (e.g., the 3% threshold for statin use as shown below). As a clinician, I’m trying to understand if this is a statistically sound way to define a decision point.

  • I understand that NNT is non-linear and varies with baseline risk. Is it still a reliable “anchor” for population-level guidelines?

  • Are there nuances in the harm/benefit ratio that NNT might overlook compared to a continuous probability-based framework when doing decision analysis curves?

2. On the role of NRI in justifying clinical tools

While the guidelines use the logic above for thresholds, they often pivot to the Net Reclassification Index (NRI) to justify the “added value” of new markers. I am curious about the following:

  • The Weighting of Events: How does NRI “reclassify” an existing decision threshold? Are the non-event and a event still weighted equally? Is this considered a valid approach to “reclassification”?

  • he “Hidden Costs” of the Marker: Unlike a risk score, a physical test like CAC introduces its own harms—radiation, incidentalomas, and downstream testing (stress tests, etc.). If a tool achieves a 20% NRI but triggers a cascade of low-value downstream procedures, how is that “tax” accounted for?

3. On the compatibility of these frameworks

Can these two approaches be used together consistently? We seem to use a decision-analytic framework (Net Benefit/NNT) to establish the threshold, but then evaluate a marker’s utility using a different framework (NRI) that does not appear to incorporate those same clinical weights.

  • Are these frameworks fundamentally incompatible for guideline development?

  • Would a consistent Decision Curve Analysis—applying the same weighting of harms and benefits to both the threshold selection and the marker evaluation—be a more appropriate standard?

Any thoughts, comments, or useful references on this would be appreciated. Ultimately, I want to help clinicians like myself work with patients to make informed decisions, and find the best ways to do this.

2 Likes

As I understand it (have not thought much about NNT), if ARR is absolute risk reduction,

NNT = 1/ARR = 1 / (P(ASCVD|Tx)-P(ASCVD|No Tx))

The graph claims, if P(ASCVD) = 3%, NNT=100? I am assuming it’s P(ASCVD) on the x-axis, because that is what the pooled cohort equations (2013) and Prevent calculate, for example.

But NNT does not depend on P(ASCVD), it depends on P(ASCVD|Tx), P(ASCVD|No Tx)…

How to then get NNT from P(ASCVD) alone?

Also they say RRR = 35%; RRR I think is P(ASCVD|Tx)/P(ASCVD|No Tx)?

What’s NND stand for?

2 Likes

This is a great topic, and important question

1 Like

RRR (Relative Risk Reduce) = 1 - Relative risk ( because P(ASCVD|Tx) is less than P(ASCVD|No Tx) ),

so RRR = 1 - P(ASCVD|Tx) / P(ASCVD|No Tx)
= ( P(ASCVD|No Tx) - P(ASCVD|Tx) ) / P(ASCVD|No Tx),

P(ASCVD|No Tx) - P(ASCVD|Tx) is the ARR,

so RRR = ARR / P(ASCVD|No Tx),
ARR = RRR * P(ASCVD|No Tx).

I guess that 3% is the P(ASCVD|No Tx).

so NNT = 1 / (3% 35%) ≈ 100 (NND)

NNT = 1 / (7% * 45%) ≈ 33 (NND)

NND is number-needed-to-treat to cause 1 case of incident diabetes in 10 years according to that guideline.

I guess this is how it’s used.

NNT is a key term in national medical licensing examination in country I worked. But to be honest, I have never seen its use in clinical guidelines in country I worked. My experience is limited; I always assumed it was a brain teaser aimed to torment students during the exam.

I am curious to hear what others think about this usage.

3 Likes

Thank you for taking the time to catch me up. Also thank you for the derivation. It is nice to see things written in terms of probabilities rather than the acronyms.

I still wonder how one is to estimate P(ASCVD|No Tx), because the pooled cohort equations provide P(ASCVD). I.e., from the corresponding 2013 ACC/AHA guidelines [1]:

“A variable representing lipid treatment was considered but not retained in the final model because lipid therapy was relatively uncommon in the cohorts and statistical significance was lacking.”

  1. Goff Jr, David C., et al. “2013 ACC/AHA guideline on the assessment of cardiovascular risk: a report of the American College of Cardiology/American Heart Association Task Force on Practice Guidelines.” Journal of the American college of cardiology 63.25 (2014): 2935-2959.

I guess because lipid treatment was relatively uncommon, they assumed it was not present. They should have at least then removed all cases that received lipids, but I’m not sure whether that would have biased the model.

Overall, as described in [2], the data used to estimate the pooled cohort equations were from (I guess this is obvious given the name) cohort studies. I think the real quantity that’s needed in a decision though is P_trial(ASCVD|No Tx), also called P(ASCVD|do(No Tx)). I think actually RRR = (P_trial(ASCVD|No Tx)- P_trial(ASCVD|Tx))/P_trial(ASCVD|No Tx), right? We don’t estimate this with observational data, because then there is confounding by indication—ie what if the people who took statins were healthier? Is it really

RRR * P_**cohort(**ASCVD|No Tx)?

If so, to combine ASCVD risk estimated with cohort with a risk reduction statistic from a trial seems like it might create a mismatch.

It would be the case, assuming that the authors of the graphic above were thinking of using the pooled cohort equations to estimate P(ASCVD|No Tx) (or P(ASCVD)), and not the trial that was used to compute ARR (this would be a better idea, IMO), or some other calculator. In most guidelines though, the pooled cohort equations are used, and as far as I know, most people at the point of care would be using those equations to derive the ASCVD risk.

Given that all this still works out, I have to think a lot more about NNT and NND then somehow being used to approximate the expected utility problem.

2 Likes
  1. It’s reasonable to anchor treatment decisions on whether the anticipated absolute risk reduction (which is ultimately what the NNT really is) exceeds a certain threshold (what goes into determining that threshold is of course a different manner. In this case it was the risk of diabetes, in others there may be things like cost/other side effect considerations). I’d also keep in mind that the guidelines do advocate for a continuous probability-based framework (i.e., calculating 10-year risk and basing the strength of the treatment recommendation on said risk).

  2. A.Lots has been said about the merits and demerits of NRI in prior discussions. Coming to the point of risk thresholds and weights, the NRI has little bearing on the former. You can not use an NRI to state the risk threshold should be changed or reclassified to some other risk threshold. The risk threshold is something you have prior to calculating an NRI. For weights, the answer is that they are generally not weighted equally. Rather, they are weighted in proportion to their occurrence. For example, if you have a 10% event rate in a cohort, you’d be assuming that events are 9x as important as non-events (90% to 10%). In other words, a single patient (with an event) who is correctly up-classified in risk based on a new marker would be worth incorrectly up-classifying the risk of 9 patients (without an event). One can modify this default weighting if need be, although most investigators go with the default.

    B. The tax is not accounted for by the NRI. The intrinsic cost of a CAC scan, the associated radiation, and potentially harmful downstream testing/procedures are ignored. That’s not the fault of the NRI per se, since incorporating these things would involve assigning actual disutilities to said cost/radiation/unnecessary procedures.

    1. I think the frameworks serve different purposes. A decision curve analysis can not give you a threshold to use. It can only evaluate net benefit across a range of thresholds (and a marker may yield net benefit up to a certain threshold and net harm thereafter; the curve itself will not tell you which of these thresholds you should use). The guideline writers have to use some other way to come up with the thresholds they need (in this case, that way was ASCVD event reduction offsetting the increase in diabetes).
1 Like

Related to one small part of what you said, I’ll bet $ that risk thresholds don’t actually exist. For them to exist the following would have to be demonstrated.

  • Ask 100 clinical decision makers whether they use a point threshold for their decision making
  • 90 or more answer yes
  • Of the 90 ask them the threshold
  • The variance of the 90 thresholds has to be close to zero
2 Likes