Prediction models are sometimes developed to give overall prognostic information to a patient (“what are my chances, doc?”) or to inform a very wide range of possible medical decisions. Perhaps more commonly, prediction models are developed to inform either a single decision, or a small number of related decisions. For instance, the Framingham model is used to inform whether a patient should be given treatment (or more intensive monitoring) to prevent a cardiovascular event; the Gail model is used to determine chemoprevention for breast cancer; various “risk calculators” have been developed in prostate cancer to help men decided whether or not to get a prostate biopsy.
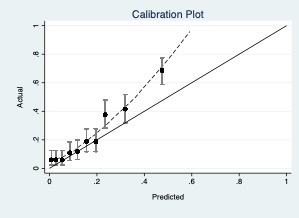
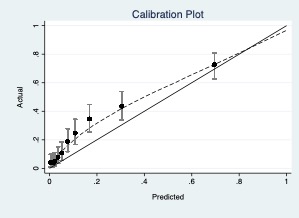
When we evaluate models, we want to be able to tell doctors and patients whether they should use that model in clinical practice. Because we are talking about a decision – use the model or don’t use the model – it is most natural to use decision-analytic methods. However, some have claimed that decision-analytic methods are not required, and that traditional statistical metrics (such as AUC, calibration plots and the like) can be used to determine whether to use a model in clinical practice. There are cases when this is undoubtedly the case, for instance, we would disfavor a model with a low AUC and gross miscalibration. But this is likely the exception rather than the rule: I propose that in most cases, accuracy metrics are unable to inform doctors and patients as to whether they should use a model.
I have created five typical, indeed, rather mundane, scenarios. In each, I describe the clinical use of the model (e.g. to predict risk of prostate cancer to inform whether to have a biopsy) and give performance characteristics (e.g. AUC). The challenge in each case is to answer the question as to whether the model should be used in practice based on those performance characteristics. The answer must be in a form that would allow a second party to agree or disagree replicably for specific reasons. So, for instance, “you should use the model because yes, there is miscalibration, but it doesn’t look too bad” would be unacceptable, because no criteria are given for judging the degree of miscalibration.
I will start with just one scenario and expand from there. If, as I suspect, no-one will be able to answer the question of the clinical value of models based on accuracy metrics, I will show the decision curves and will conclude that only decision-analytic methods can address questions of model value.
Scenario 1
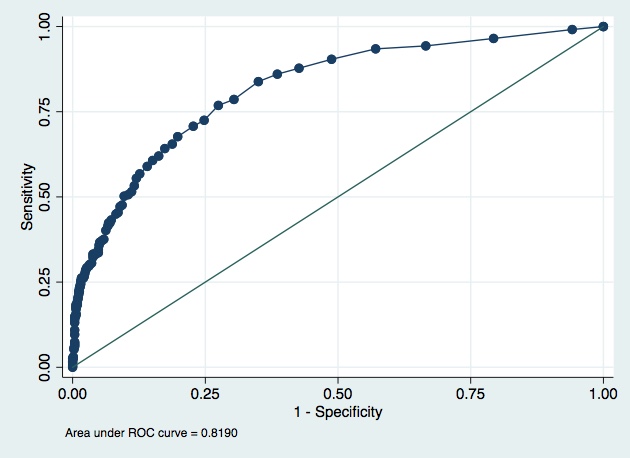
Two models have been proposed to select patients at high-risk for aggressive prostate cancer amongst those with elevated PSA. These two models are evaluated on an independent data set. Should either of these models be used to advise men on prostate biopsy? If so, is one preferable?
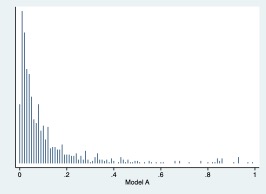
Model A.
AUC 0.819
Pseudo R2 0.2065
Root MSE 0.36239
Variance of phat 0.0447587
Brier score 0.1371
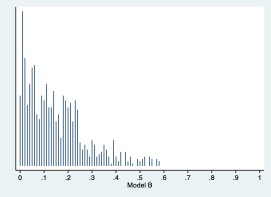
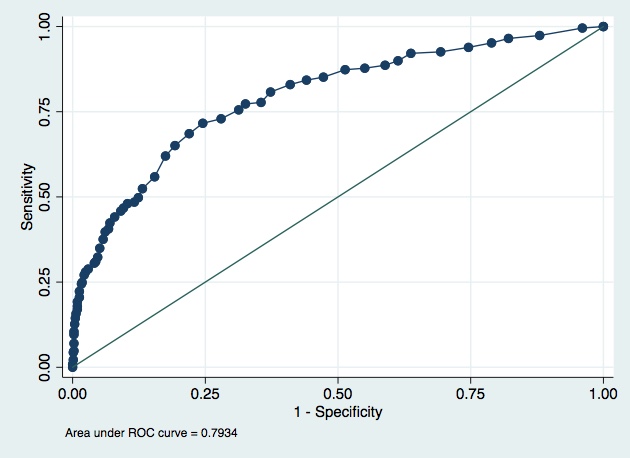
Model B
AUC 0.7934
Pseudo R2 0.2049
Root MSE 0.36759
Variance of phat 0.0196621
Brier score: 0.1420