I am using a zero inflated beta binomial regression model for predicting an outcome that assumes integer values ranging from 0 to 10, where 0 = absence of the finding and 1-10 = extension of the finding when present.
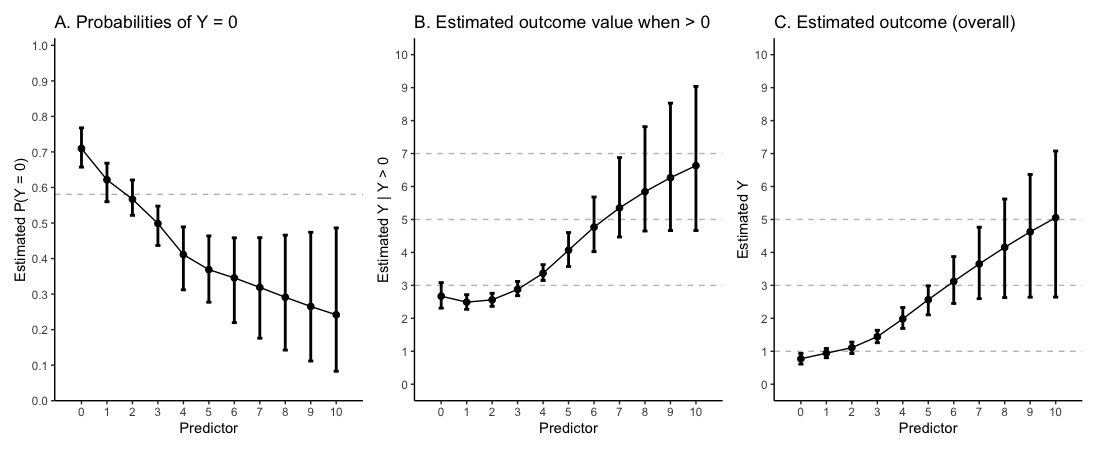
I used the formula provided here (amazing guidance by the way) to get P(Y = 0) and to estimate Y given the value of a predictor whose model I fitted using restricted cubic splines with knots at 1, 2 and 5. Hope setting knots to successive scores is not problematic - most patients are concentrated in these scores.
Then, I divided this estimate by (1 - P(Y = 0)) to get the estimated outcome among patients who do have the outcome to some extent.
It seems interesting for me to say something like “One has a lower chance of being outcome-free with higher predictor values (Graph A). However, if one has the outcome, it is expected to behave similarly with predictor values between zero and three (Graph B). When considering all patients together, the estimated mean outcome values are shown in Graph C.” However, I am afraid that the information in B may be useless due conditioning on the outcome.
Can you say more about how your outcome variable is generated? Is it an ordinal rating scale for the severity of a condition, or something like that? Is it possible an ordinal outcome would make more sense for your data? Similarly, is the predictor also really ordinal rather than numeric?
If understand correctly, you’re using the initial ASPECTS score as one of the predictors of post-treatment ASPECTS score (possibly along with other predictors, such as a treatment indicator and maybe other patient characteristics)?
This isn’t my area of subject expertise, but from skimming the page you linked to, the ASPECTS score seems like an ordinal variable. That is, even though the ASPECTS score is rendered as an integer 0 through 10, it is really a series of ordered categories, where a higher number is worse than a lower number, but the “distance” between each successive value isn’t necessarily the same (and perhaps is unknown). If that is the case, it seems like it might make sense to treat both the outcome and the predictor as ordinal.
Hi Joel, thanks. I agree that handling the post ASPECTS as an ordinal variable would make sense. However, I have decided to use the beta-binomial model both because it also seemed to fit the research question and as a learning exercise. A comparison between the models would be interesting though.
This could be a problem. I see very few practitioners doing the diagnostic plots to show adequate fits of beta-binomial, Poisson, or negative binomial.
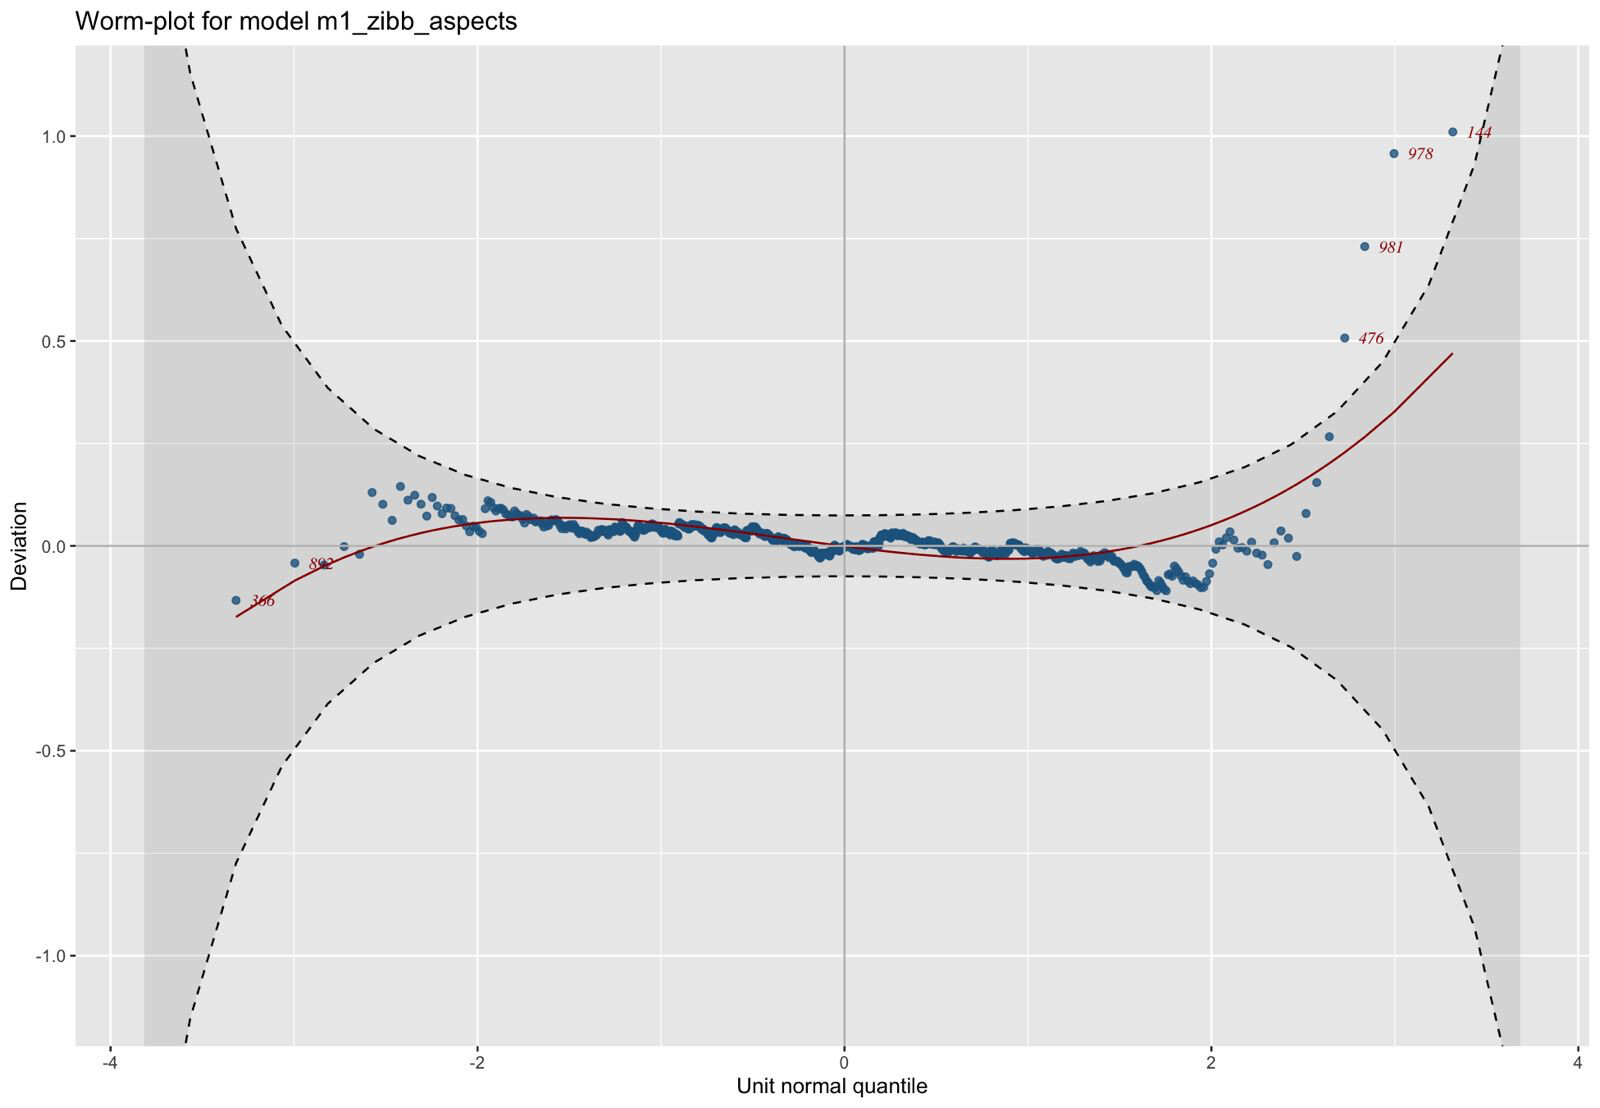
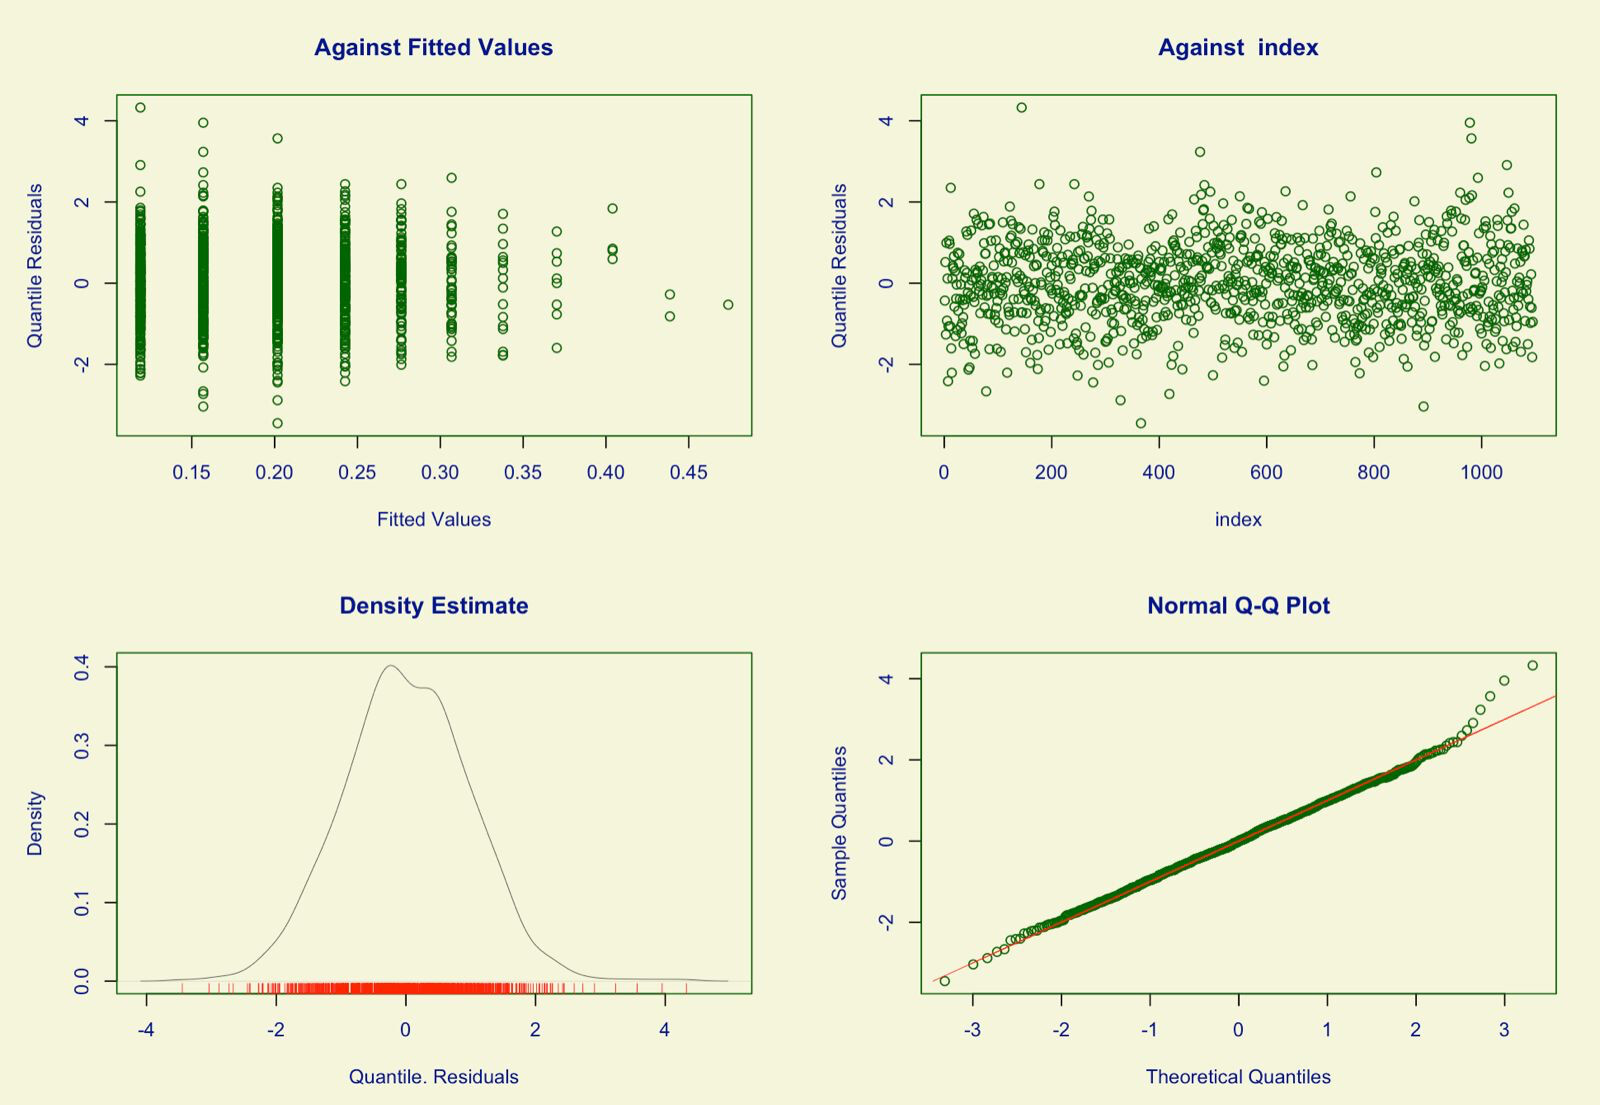
Yes, indirectly. For either frequentist or Bayesian modeling you should also make plots (like qq plots) that reveal departures from distributional assumptions.
Fortunately I had done that according to Tiago’s recommendations in the link I mentioned and the GAMLSS book. The functions I use for posterior predictive checks do not handle GAMLSS models yet.