So I had a data of 26 cancer patients and their 5-year overall survival (i.e. event as death) was around 57%, however, when I calculated 5-year event-free survival, defining the event as death or relapse, I got 61%.
Is that (statistically) possible in any shape or form?
No. By including an additional event definition the event-free set can only stay the same size or shrink. You’re either looking at the opposite of survival or did something wrong while combining event definitions.
2 Likes
One possible exception: if the determination of relapse (or whatever the nonfatal event is) sometimes is not possible due to missing data. Then the two analyses may have different denominators and all bets are off.
6 Likes
Thank you for your input.
Thank you, Prof. Harrell. I really appreciate your input here.
I have revised the data, and I cannot find anything wrong with it. The mistake is probably just taking a cut-ff for OS and EFS beyond their median FU (e.g. at 60 months).
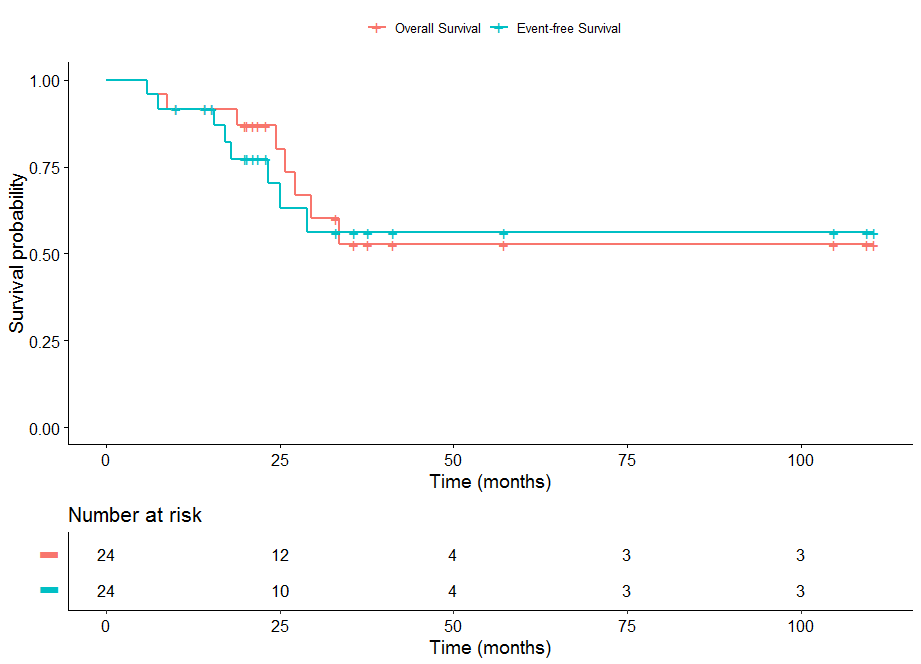
This is how the KM curves for OS and EFS look like. If anyone is interested, I can send you the excel sheet. (NB they are 24 not 26 as in OP, the paradox resolved once 2 more patients were added.)
Have a look at the last individual who has an event for overall survival — around 30-35 months, where the red line crosses over the blue. They should also have an event for event-free survival at that time, which would cause the blue line to drop at the same time, and it would stay lower. As @f2harrell suggested though, I’m guessing that individual has been censored for event-free survival prior to their death, which removes them from that risk set, so the event doesn’t count and the curve doesn’t drop. The KM estimate uses the information that the individual’s event time is after their relapse censoring time, but doesn’t take into account that you also have an upper bound on it, i.e. their death time.
I’d agree that looking at 60 months, where you only have 3 individuals still at-risk, is not very informative. There would be a lot of uncertainty around those estimates.
Aside: It’s curious that the red curve drops by the same amount as the blue at the times of their respective third events, because that suggests they have the same number at risk. But it looks like there have been three event-free survival censored observations prior to that, which would give it a smaller risk set (& larger drop). Unless those individuals are also censored for overall survival at that time and the red crosses are just hidden behind the blue? Just something else you might want to check.
3 Likes