My project is focused on tracking Immune system during cancer immunotherapy.
Currently, I’m trying to understand if the changes in diversity of immune system is associated with response to treatment.
Most of the publications try to associate only a single diversity index (e.g. Shannon diversity) with response to treatment.
However, I think only one index is not enough to represent the immune system. So, I decided to construct a profile of diversity indices which can successfully represent the immune ecosystem.
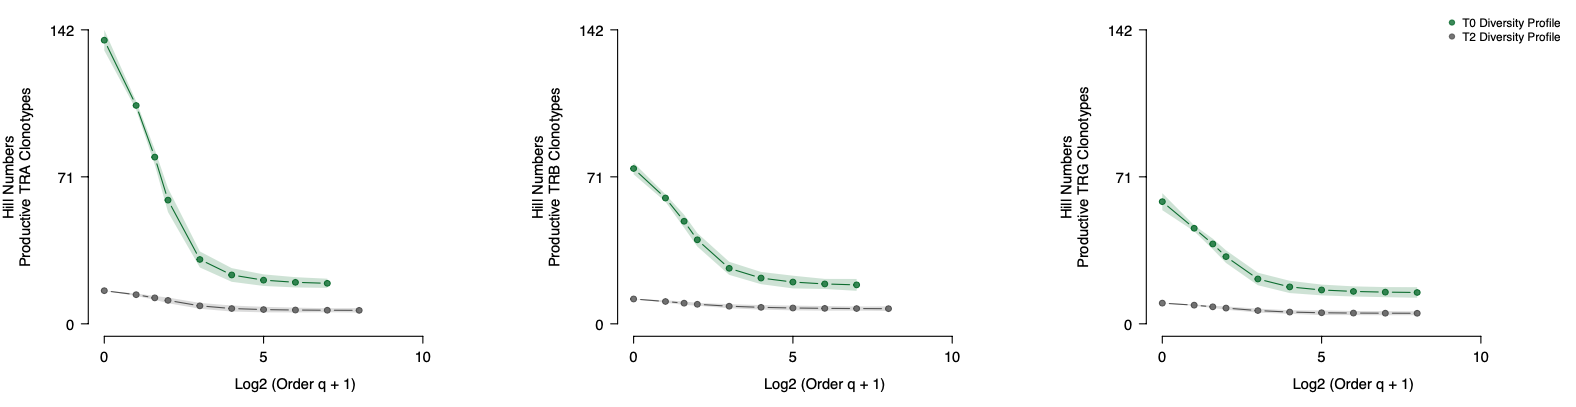
These diversity indices differ with respect to the weight they give to dominant immune populations. The higher the order, the higher the weight of dominant clones and the lower the weight of rarer clones.
The profile keeps dropping until it levels off and doesn’t change any more.
I attached a figure that shows one of these diversity profiles.
Now my challenge is that I’ve failed to find a method to associate the profiles with response to treatment. When there is a high drop in the profile, it means particular immune cells reactive to cancer have expanded and if the profile is linear, it means the immune system is even and we don’t have expansions. Now, I wanna know if there’s a way you would suggest to associate these drops (until the profile levels off) in the profile with response to therapy? a method that takes into account all the points in the profile.
It looks like you are doing a T cell receptor repertoire profiling analysis? There is a nice discussion of the relationship of different diversity metrics here: Jost L 2006, Oikos “Entropy and Diversity” (https://onlinelibrary.wiley.com/doi/10.1111/j.2006.0030-1299.14714.x) It’s unclear which diversity index would be “right” for your particular situation, as none of these seem necessarily more valid than others for all questions, but we generally use the Shannon Entropy in our TCR repertoire diversity calculations. Also, I don’t know how you generated your data, but you might want to assess for undersampling effecting your diversity index values (we published on this if you are interested: Bortone et al, PMID: 33177107)
I don’t know if this is exactly what you want, but I’m currently taking a deeper dive into the methods proposed by Molitor et al. to do something that I think is similar in spirit to what you’re trying to do: https://academic.oup.com/biostatistics/article/11/3/484/257407.
You could take a look at joint longitudinal time to event models. There is a lot on this in the PKPD literature with dynamical models of longitudinal data.