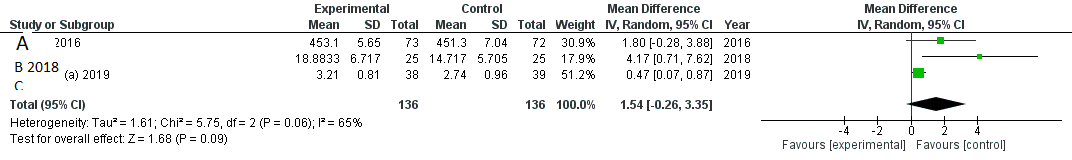
Hi everyone, I need your help. I am doing a meta-analysis using RevMan 5.3 software. I used 3 studies as my data. The study is to investigate the effect of the Flipped classroom as an experimental group vs traditional teaching method as control group. Each study mentions Flipped classroom is more effective. In the data entry, experimental group is on the left column, and control on the right. When the data is entered, Forest Plot shows more favored toward the control group. I left all setting defaults. Why it doesn’t show experimental as favored in the output as each study shows experimental group is better? I am confused with Forest Plot. Please explain it. I thought, experimental group should be in favor particularly in this case. Here is the graph:
Looks like you have entered the experimental group as control and vice versa. The plot shows the mean differences of 1.8, 4.2 and 0.5, and that corresponds to higher values in the Experimental group.
Here is how to work it out according to Cochrane guidance; so it really depends on the outcome how you interpret and you can also change the default to an easier to read option.
If the outcome of interest is adverse (e.g. mortality), the results to the leof the vertical line favour the
intervention over the control. That is, if result estimates are located to the le, it means that the outcome
of interest (e.g. mortality) occurred less frequently in the intervention group than in the control group
(ratio < 1).
If the outcome of interest is desirable (e.g. remission), the results to the right of the vertical line favour
the treatment over the control. That is, if result estimates are located to the right, it means that the
outcome of interest (e.g. remission) occurred more frequently in the intervention group than in the
control group (ratio > 1).
Hi Dina,
Please I have just run into this exact problem you had in terms of the forest plot going in the opposite direction of your individual studies results. Just like you, my individual studies (3) reported that the experiment is significantly better than the control but to my utmost surprise, the the forest plot is favouring the control and i don’t understand it. I made sure the values for the experimental group and the control group were accurately recorded in their rightful columns. Please were you able to find solution to your own forest-plot issue? Please can you share how you were able to handle that?