I would like to do a cross-sectional study, 1-year period prevalence) and have performed the univariate analysis for my variables (i.e. frequentist t-test (no assumption for equality of variance) and chi-square (no correction)), and have gotten very small p-values for most of the variables. I think it is largely due to the large sample size, ~46K (~21K for diseased and ~24K for non-diseased) – data obtained from registry. I understand that we should steer away from p-values and use 95% compatibility intervals. How is this typically presented in papers? Would it be mean difference (95% CI) for continuous and proportion difference (95% CI) for categorical? Any reference papers?
Should I looking into using Bayesian t-test and proportion test due to the large patient cohort? Subsequently, I would like to do a logistic regression, and may also use Bayesian method if I adopt it in univariate analysis.
is the prevalence in the large dataset low for the event of interest? maybe then you have low absolute risk and “statistically significant” relative risk, when the increase for one group over the other is unimportant? Thus show estimates for both, rather than p-values. Estimates from a model (logistic regression) including all variables, especially those known to be predictive of outcome (ie established in the literature). I wouldn’t do “univariate” models (i think that’s a misuse of the term too; univariate/multivariate refers to the outcomes, not explanatory variables). Logistic regression was covered in a BBR session (Frank Harrell youtube series)
1 Like
How many candidate variables are there? Why did you do univariate analysis? I can’t see the relevance of that.
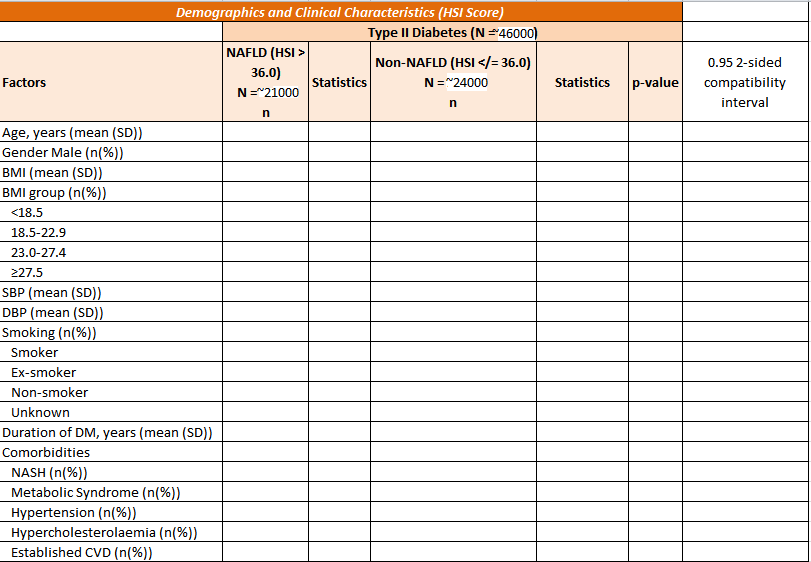
I am looking at the prevalence of fatty liver patients among type 2 diabetics, which is almost half of the patient cohort. Continuous variables were analysed using traditional t-test and categorical variables, using chi-square test. The p-values obtained for most of the variables are very small (<0.001), so I am wary of reporting them. For large data, would it be more appropriate to report mean difference (95% CI) for continuous and proportion difference (95% CI) for categorical variables. Or should we use bayesian and report bayes factor? Or simply non-parametric would do.
Additionally, I have used 1-year period prevalence for this study, i.e. all variables are aggregated by means (mean BMI, mean HbA1c per patient etc.) in that particular year. I have approached it this way as the variables may have been collected at different time points during the year, and different patients may have different number of records for each variable.
Nothing there suggests doing any univariate analysis. And in place of that table thing about the graphical approach detailed here.