Hi! I have searched the web and have found no convincing answer, although this should be pretty easy. My question separates into 2:
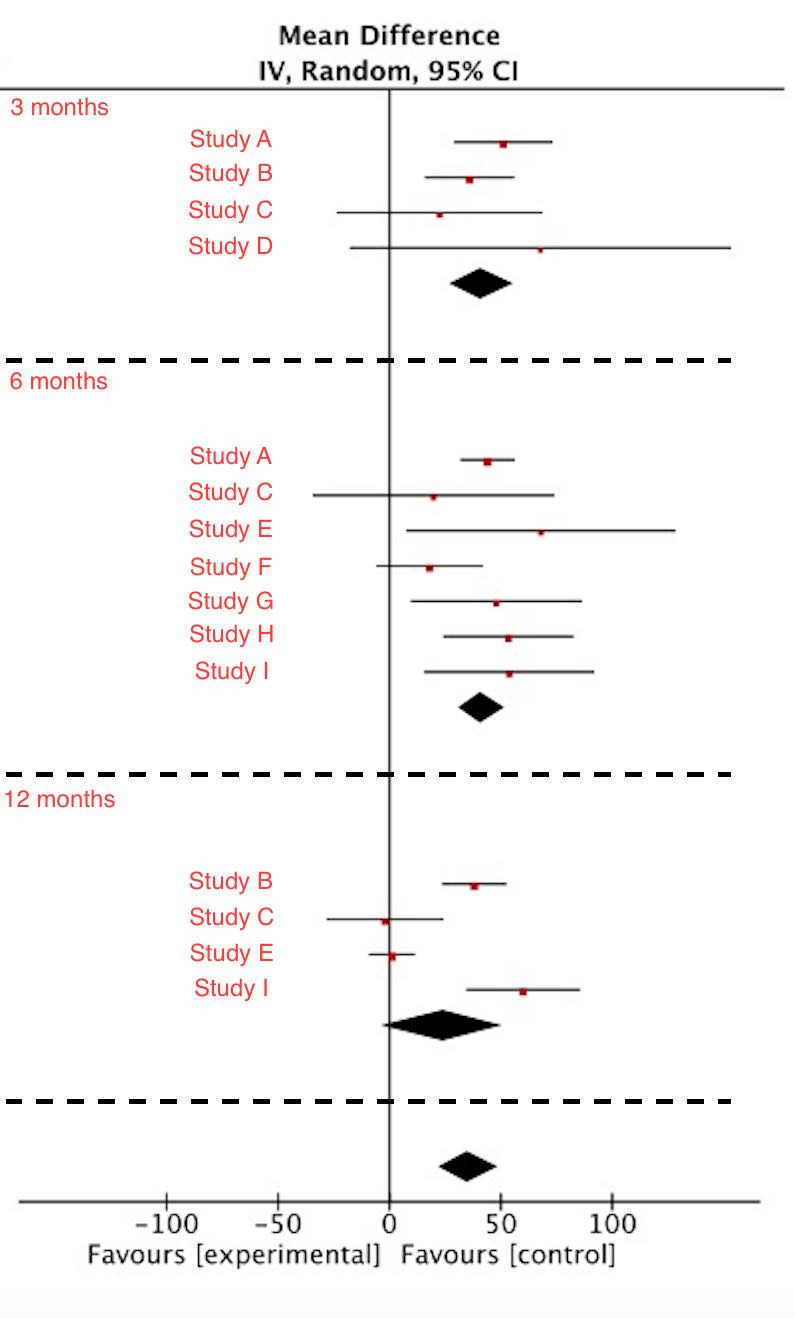
1- Is it reasonable to trace a trend line of the evolution of a parameter over time from the pooling of different studies, each of which do not contain all time points (although all studies are included in the pre-intervention group and all studies have similar inclusion/exclusion criteria)? See the pictures below for exemple: the forest plot picture shows all the different studies’ contribution to each time point. Then I compute a graph from the mean ± SD of each time point, with a trend line. Is this heresy?
2- If this is acceptable, can we (and how do we) compare these time point changes among each other?
Thanks!