Dose-volume histograms are cumulative histograms of radiation dose received by a given organ along the X-axis against the volume in the Y-axis. Radiation Oncologists will often specific thresholds (constraints) in such curves which will enable us to make the decision whether the plan is acceptable.
For example, a commonly used constraint is the volume of lung receiving a minimum dose of 20 Gy. We know that if this volume is more than 35% then the risk of developing a clinically severe radiation pneumonitis is about 20% or higher.
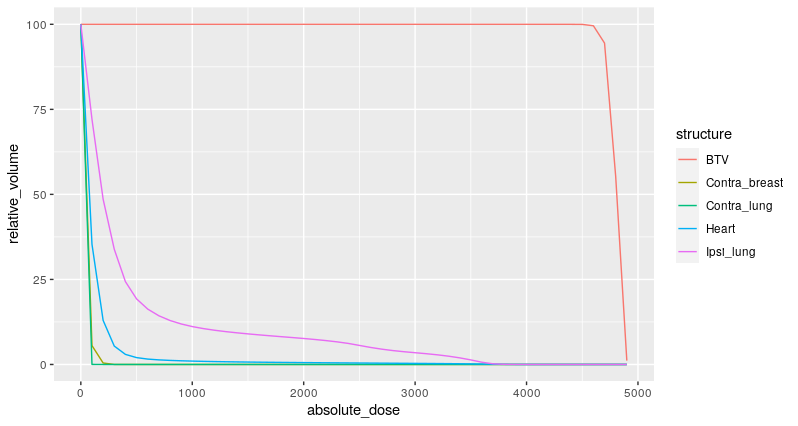
Example dose volume histogram: In this plot the volume of lung that receives a dose of 2000 cGy (20 Gy) is approximately 10%.
One of the issues with this approach is that it is easy to meet a point constraint for a dose-volume histogram but often difficult to meet multiple dose-volume constraints. Another issue is the way these constraints are derived is possibly methodologically flawed. The usual process is to run a logistic regression against each dose level (e.g. 5 Gy , 10 Gy, 15 Gy … and so on). For each regression model we then state that this model has the highest AUC.
We obviously lose a lot of information that the curve contains the moment we decompose the information contained in the curve to a certain point. I imagine that in a rigorous external validation most of these so-called constraints would not stand up to the scrutiny.
Ideally, we should have a curve based probability of toxicity - a method that takes the curve shape and then tells us the probability of developing the toxicity with error margins - to enable the clinician to decide whether the plan is acceptable.
Note that work in this area has involved usage of Normal Tissue Complication Probablity (NTCP) models which convert the non-uniform dose to an “equivalent uniform dose” and then uses various parameters related to volume and dose sensitivity of the organs (often derived without very rigorous experimental research) to develop a complication probability for the dose.
(example article that describes this https://www.ncbi.nlm.nih.gov/pmc/articles/PMC4041542/). However till date most clinicians end up using simple dose volume constraints which are clearly suboptimal.
I wanted to know if the recent advances in predictive modelling techniques can be applied to such situations especially the work of decision curve based on prediction models. Further doing multiple ROC estimations from multiple logistic regression sems like a very fallacious method.