Laaaate answer here, but does not a hazard ratio imply that we have two numbers?
That is why I thought this should be labeled partial hazard and not a ratio. I.e. if we extract to values from the curve we can calculate the ratio, but if not the curve displays some hazard function? I must confess that I am a bit out of my element here, but this is how it was explained to me.
Dear albertoca, congrats on your wonderful 3D surface plot and contour maps. Could you please share the code? (I found no example for the 3D surface plot in the tutorial by Bender and also he is not using anti-log in order to present HR)
Use the visreg2d function in the visreg library. To graph the hazard ratio use the argument trans=function (x) {exp(x + int)} where int is the intercept of the generalized additive model from Bender’s code. I hope it works.
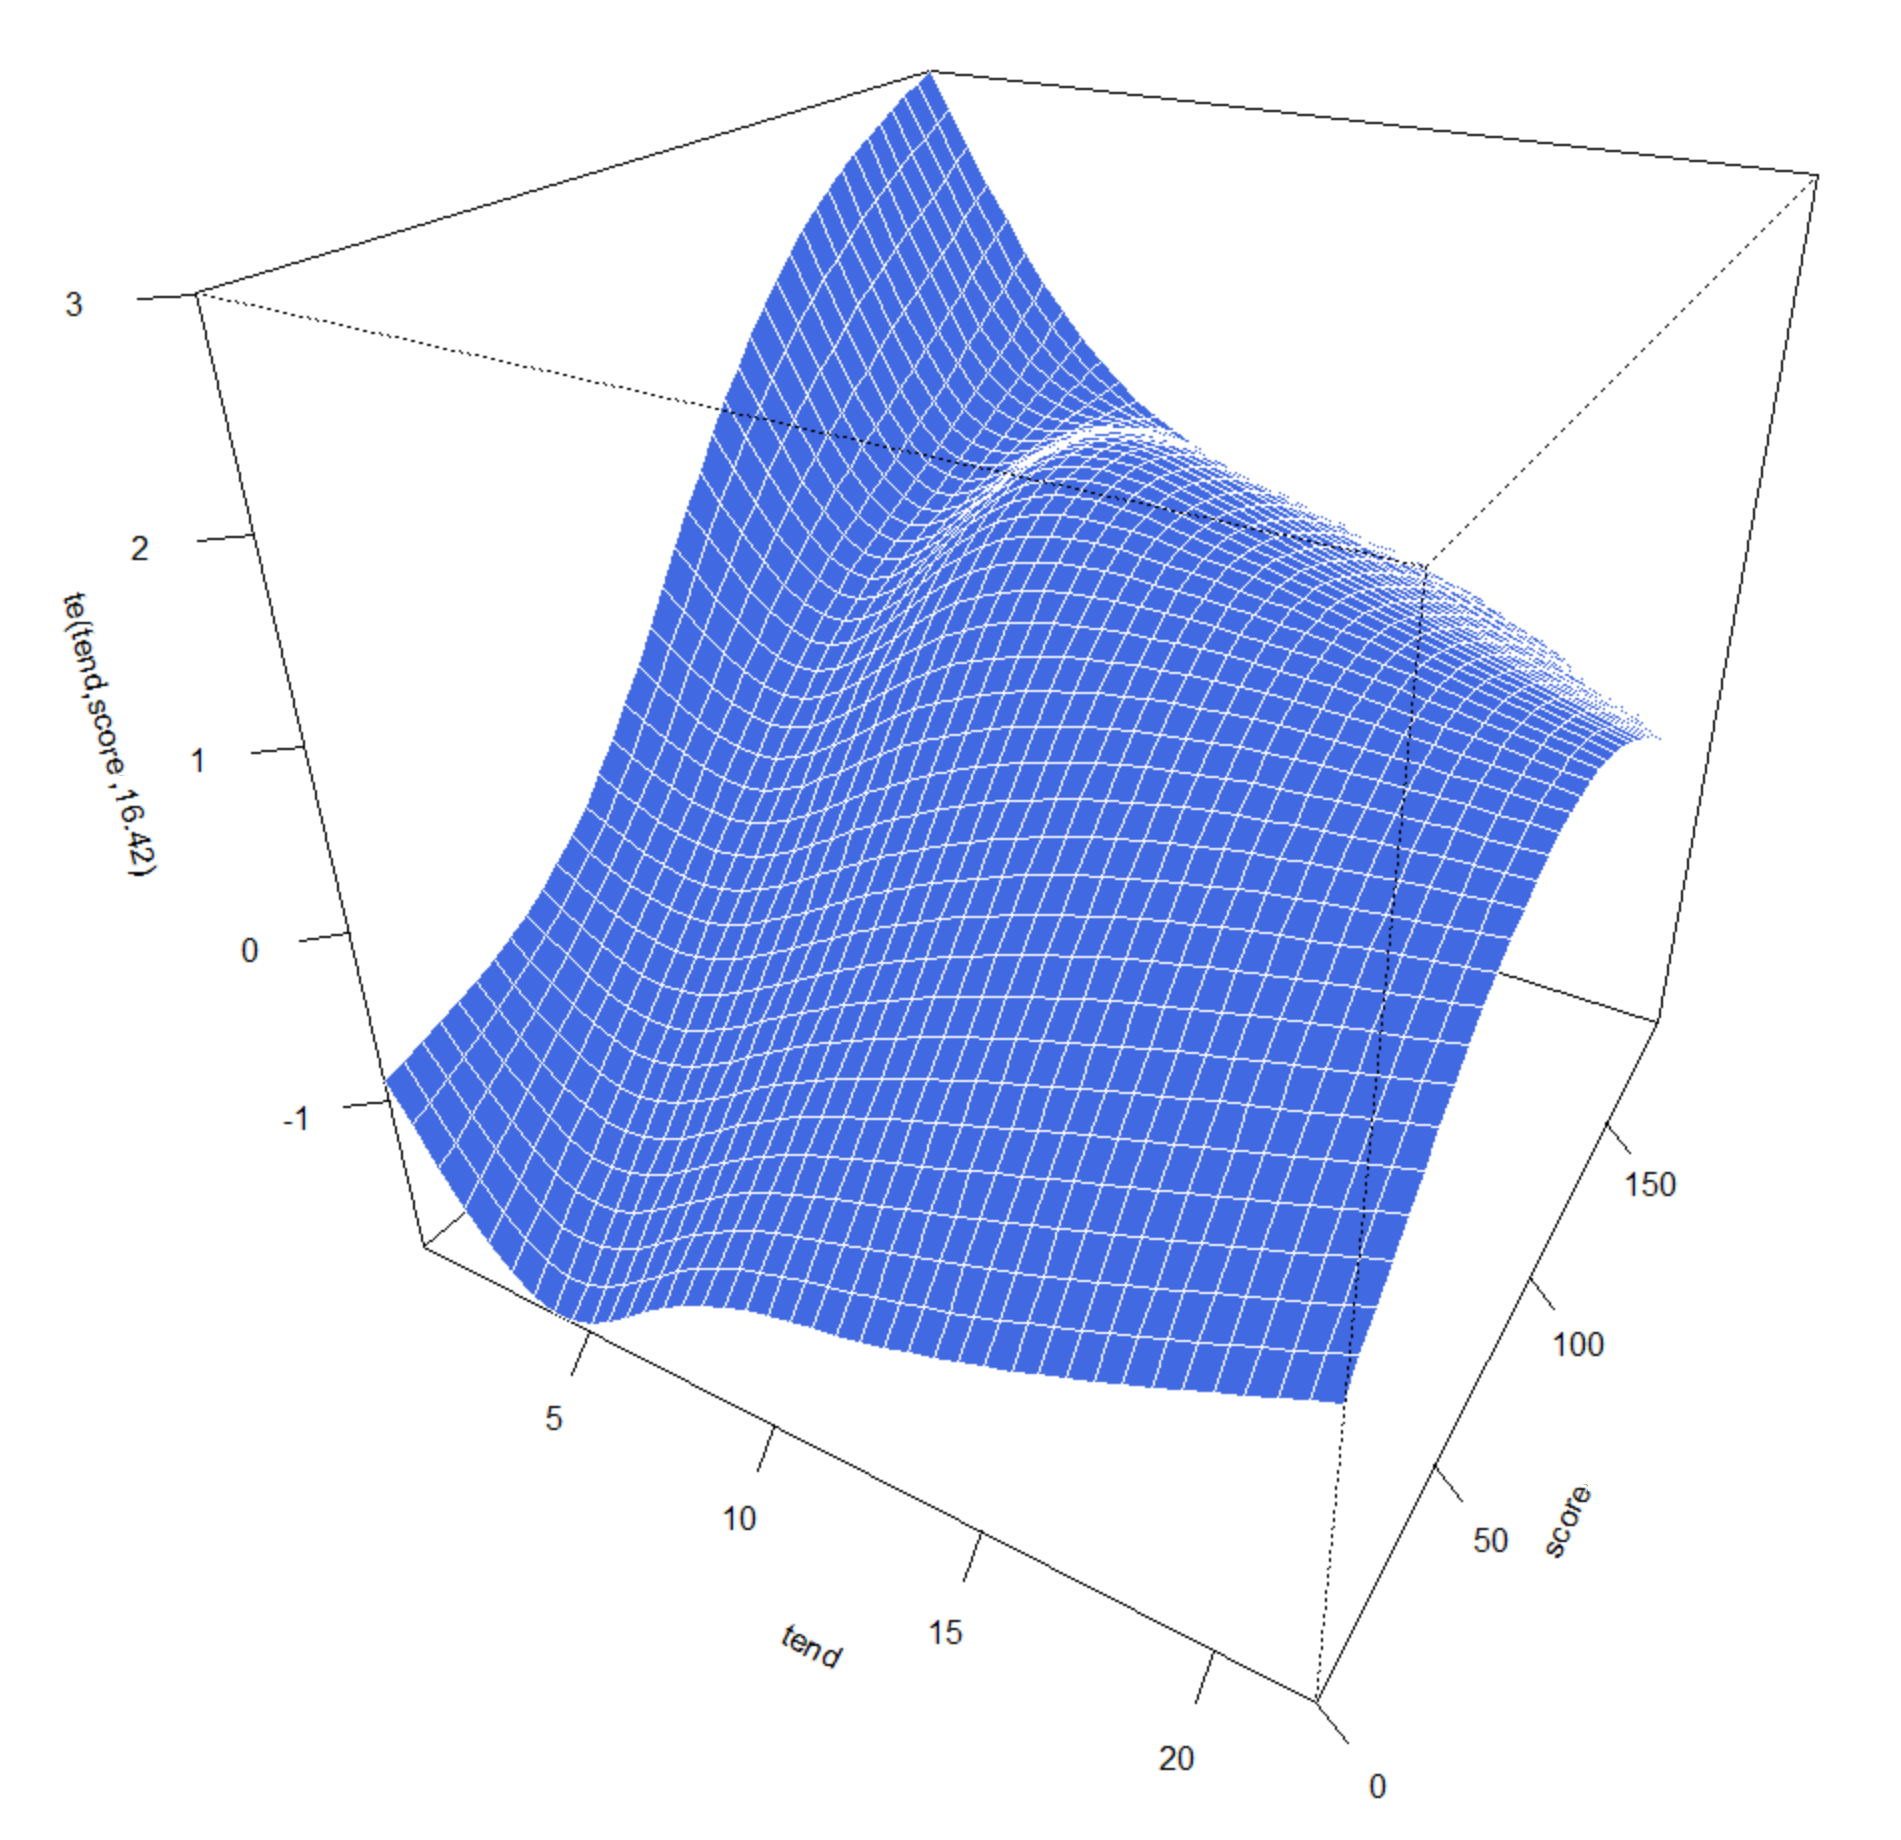
Dear Alberto, thank you very much for your help regarding the beautiful visreg2d function. My model is very simple including only one covariate (score):
pam ← gam(formula = ped_status ~ te(tend, score), data = ped_bita, family = poisson(), offset = offset)
Could you please provide the code for the trans=function (x) {exp(x +int)}? (I have the intercept from the model).
Something similar should work:
visreg2d(pam, x=“score”, y=“tend”, plot.type=“persp”, theta=150,color=c(“blue”),trans=function(x){exp(x+your_intercept)})
Absolutely, perfect! A million thanks and of course one citation in my methods (although not an oncology paper, cardiac surgery deserves also such a beautiful representation of a predictive score).
I have frequently come across this problem, and recently discovered the casebase package for R. Did not use it yet but seems to offer a comprehensive solution to time-related event issues:
From the fitted hazard model, we provide functions to readily calculate and plot cumulative incidence and survival curves for a given covariate profile. This approach accommodates any log-linear hazard function of prognostic time, treatment, and covariates, and readily allows for non-proportionality. We also provide a plot method for visualizing incidence density via population time plots.

