Hi I really like Hmisc::summaryM() at the last page of chapter 11 of R workflow book to print an informative yet condensed table for summary statistics.
However, when I use it, the html table doesn’t have lines between each rows. I wonder if I should set anything in quarto to make the table easier to read. I uploaded what my table looks like. With only alternating colors but without lines between rows, some monitors can not properly display the subtle contrast. On the monitor of one of my colleagues, the entire table has only white background and there is no trace of alternating colors between the lines. Any advice is greatly appreciated.
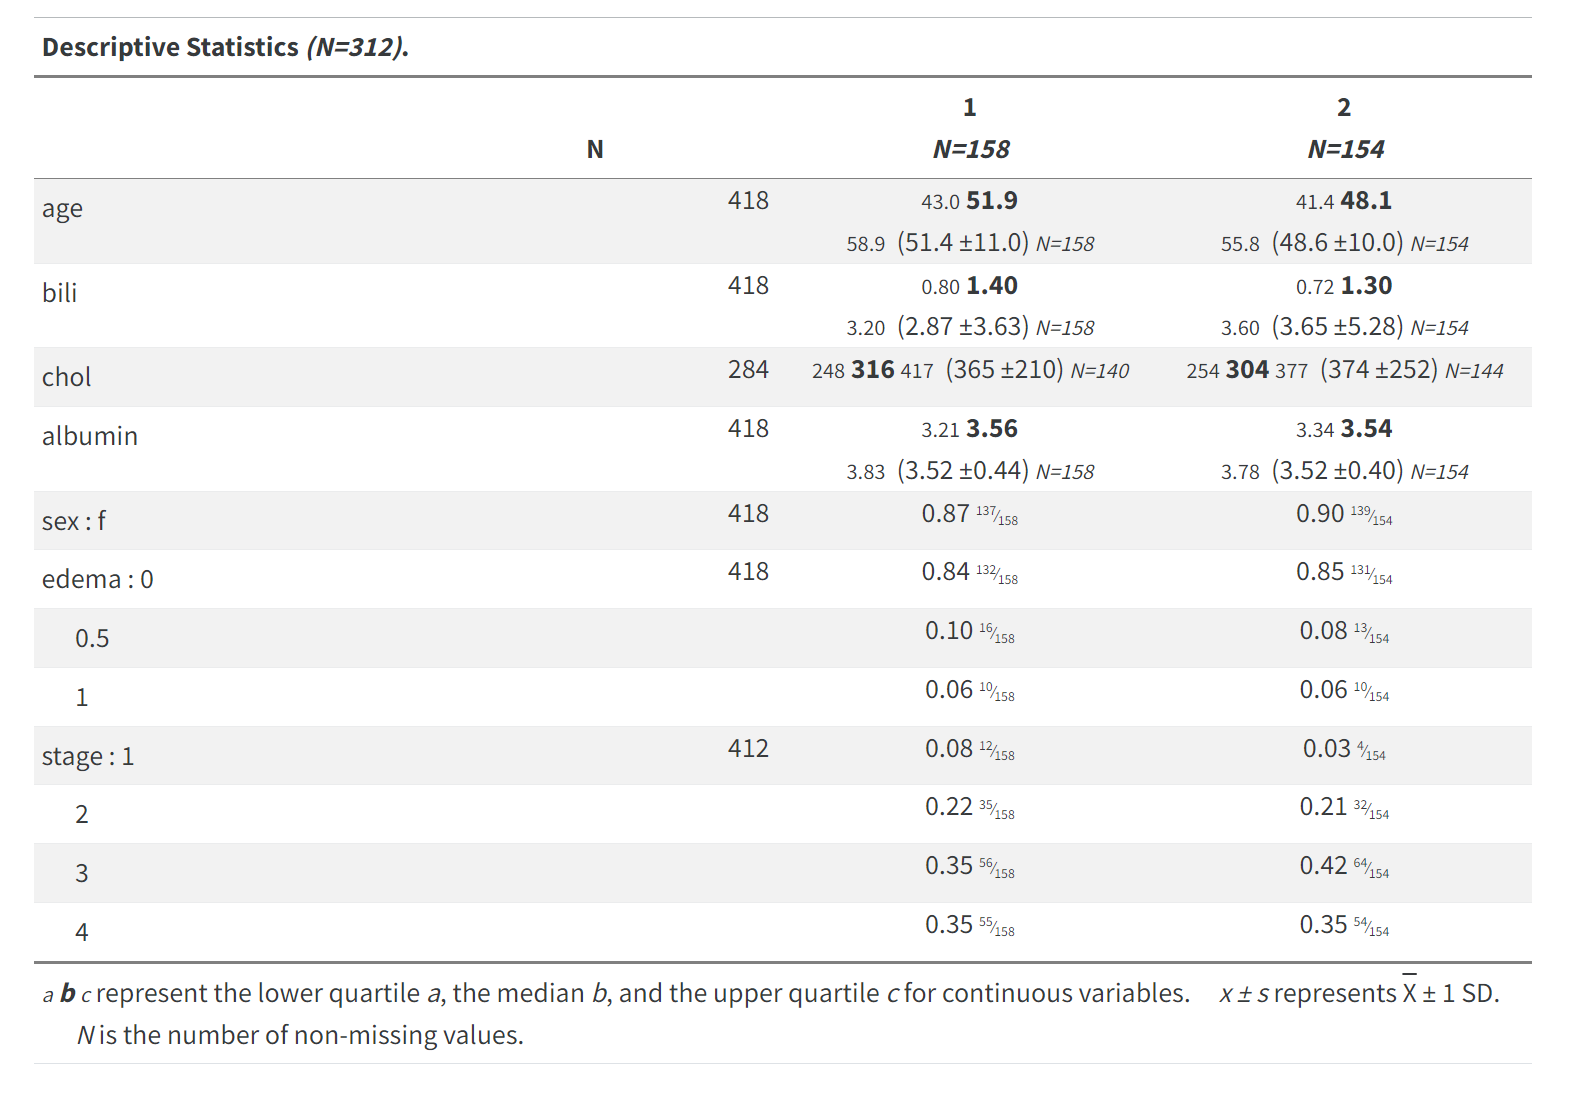
Below is a reproducible code and output image.
---
title: "test_summaryM"

---


```{r}

# Load three packages
library(Hmisc)
library(qreport)
library(data.table)


data(pbc, package='survival')
p = copy(pbc)

setDT(p)

options(prType='html')
s <- Hmisc::summaryM(age + bili + chol + albumin + sex + edema + stage ~ trt,
              data=p)
# Define a function to specify a 20% smaller font size in html
smaller <- markupSpecs$html$smaller   # is in Hmisc; see also smaller2
print(s, npct='both', prmsd=TRUE, msdsize=smaller, prN=TRUE,
      middle.bold=TRUE, round='auto')