I want to calcualte odds ratio per one standard deviation in my research.
As far as I know, there are two methods. Which one method is right?
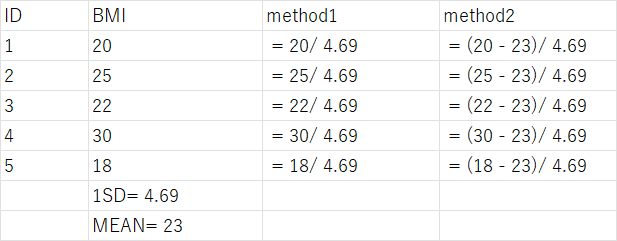
Method 1: new_var = old_var / standard deviation of old_var.
Method 2: new_var = (old_var - mean of old_var)/ standard deviation of old_var.(ie. switch variable to Z score)
For example, I plan to see the assocaition between BMI and hypertension, I want to calcualte odds ratio for odds of hypertension for per one standard deviation of BMI. Which method should I choose to handing BMI before modeling?
Standard deviation only applies to symmetric distributions so I wouldn’t use it in this context. And always work on the log odds scale then work backwards when needing the OR scale. See RMS for things like inter-quartile-range ORs which are much better than using standard deviations, which usually have no medical/biological meaning. But the most important thing to present is the plot. The partial effect plot may be obtained, for example, by fitting a spline function in log BMI.
But—wait a minute—BMI is often not a good summary of height and weight. Fit a model with log wt and log ht and see if the ratio of their coefficients is close to -2 as BMI dictates.
Thank you very much professor.
I have read the section about inter-quartile-range ORs in your BBR book. It is great and in fact I am reading that book when I have time and learning how to use rcs (that is the reason why I find this site). On the other hand, per standard deviation is very common in epidemiological papers, so my boss requests me to do that (beacuse we are not statisticians so we prefer to do analysis according to previous papers). If the variable is the symmetric distribution or a distribution which is suitable for calcuating per standard deviation, how to use per standard deviation to calculate relative ratios?
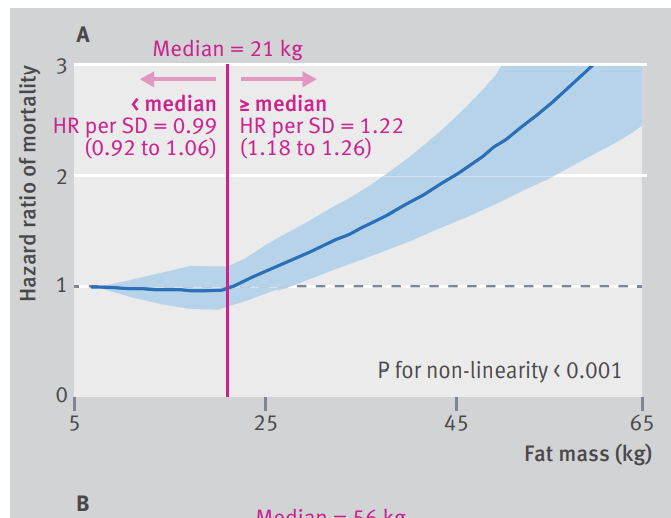
For example, in this paper,
they calculated the hazard ratio per standard deviation after rcs analysis. Assuming that in this situation, how to calculate it?
Please tell your boss that SD is not appropriate in this context. SD-based changes are only interpretable if the covariate has a normal distribution. The use of SD also only works when the regression relationship is linear. That is because for a 1 SD unit change of X to have any meaning the corresponding change in Y needs to be independent of the starting X value. That is true only under linearity.
And don’t forget to highly question the adequacy of BMI in summarizing height and weight.
Thank you very much professor.
I will talk it with my boss. And the suggestions about BMI is very instructive and of course I dont forget it. Happy new year!(although a little early)