Let’s see a Cox model:
model <- coxph(Surv(time = start, time2 = stop, event = death) ~ sex + treatment + age + year + deprivation + num_drugs + smoking_status, data = colon)
Now let’s test the assumption for the proportional hazards:
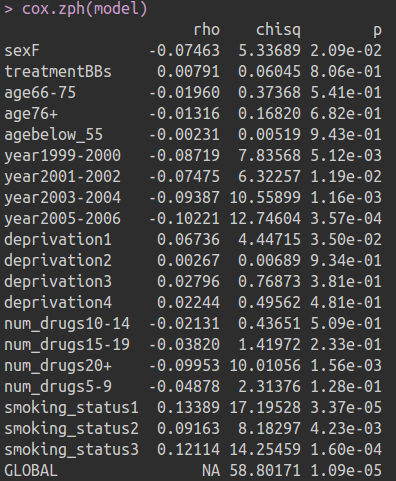
cox.zph(model)
Here is the output:
We can see that sexF, year, deprivation1, num_drug20+, smoking_status1 and smoking_status 2 don’t satisfy the assumption. So we need include an interaction with time for the variables.
Here are my questions.
For a categorical variable with ≥ 3 levels (deprivation, for example), how to know if the whole variable satisfies the proportional hazards assumption if there is only 1 level of the variable doesn’t satisfy the assumption (deprivation1).
How to include an interaction with time for the variables? Which variable can be considered as the time variable. In SPSS, there is a auto-generated time variable T_ in the Compute Time-Dependent Covariate menu. But how can we include the interaction with time using R?
re Q1; plot log-cumulative hazard. Do you have access to dave collett’s modelling survival data in medical research. See example 4.9 in section 4.4.1 (the log cumulative hazard plot). He gives an example of a variable with 4 levels…
@PaulBrownPhD Interested if you you think it matters whether this is coming from an RCT or observational trial. I have seen a lot of people bending over backwards to add time-varying effects to database analyses when really the first idea that comes to mind for me is that it’s an alarm bell that your model is wrong.
someone said to me recently (they were not an RCT person) that you should not interpret violation of the PH assumption as a problem, you should interpret it as a ‘result’, and quite an interesting result too. And once you have accepted that then you maybe carve up time into intervals where the PH assumption is reasonable and present your results accordingly. For an RCT i would worry about the effect on power since the whole thing has been set up based on that (and i read a paper that high censoring and divergent hazards mean a loss of power using Cox). Also, for whatever reason, I have a fondness for the AFT model. I like Dr Richard Kay and his name is on that paper i linked to above, thus i’m persuaded by it. And it’s maybe easier to explain to clinical people because you have a wonderful analogy of dog years ie 1 human year is 7 dog years or whatever.
edit: according to my notes from @f2harrell 's course he said “acute eg trauma - AFT, but cox ph for chronic illness”
What others have said is excellent. Using cox.zph to help draw smooth scaled Schoenfeld residual plots. If most of the effects weaken over time, this is evidence for a log-normal or log-logistic AFT model possibly fitting better than Cox.
Of possibly more importance than PH is the lack of fit created by categorizing some of the continuous variables in the model.
I had the same problem a few months ago. Following a case from Professor Harrell’s RMS book we used a log-normal AFT model for an article that is now under review. I think it’s the best alternative. Separating time into intervals has drawbacks and does not completely solve the problem of non-proportionality. Introducing an interaction with time seems unconvincing to me on many occasions. In these scenarios, it is best to avoid proportional hazard models.
E.g. the R survival package survreg function or it’s easier to use front-end the psm function in the rms package. But think first about global model fit as discussed above, and make the type of Kaplan-Meier residual plots I showed in my RMS course notes.