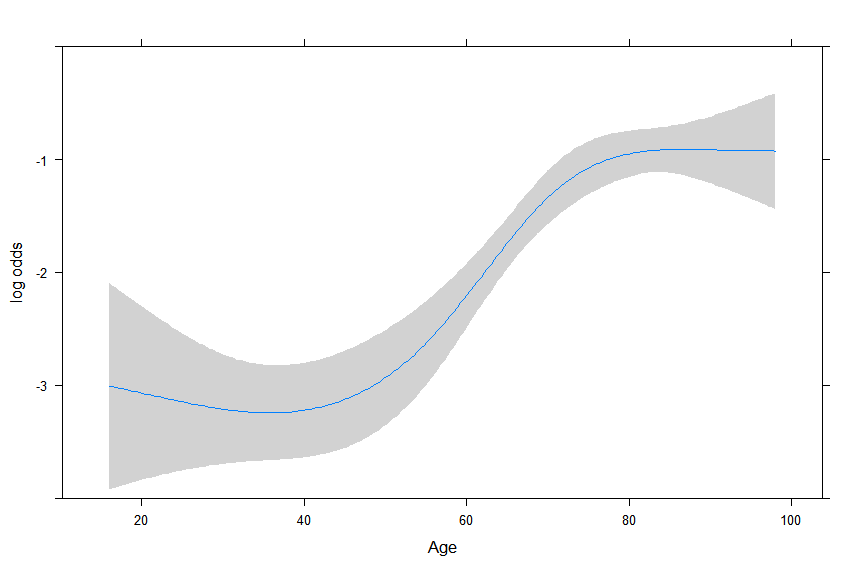
I not so fimiliar with this as I used to adopt age as a single continous variable all the time. I am trying to figure out the appropriate knot number and cut-off of age to be used in my model for 6 months mortality. By the default rcs function, here I tried with knot 3, 4, 5. I am not sure should I use 3 or 4 as the knot or should I just input the age as continous factor like before.
And as shown below, the default cut-off age are not the ones we commonly applied. Should I mannually set the age cut-off close to the knot ones? Such as for with 3 knots, I should set perhaps 30, 65 and 85; and for with 4 knots, I should set perhaps 20, 55, 70, 90? Because I saw people using the restricted cubic spline and their cut-off value for the age are quite “clean”.
And a minor issue is that I cannot find a way to plot the x-axis in smaller increment, the age here starts from 16 year old.
And I can only upload one picture now, I uploaded the one with 4 knots. The picture with 3 knots is quite linear.
The default is to get predictions for the 10th smallest to the 10th largest age. You can say Predict(fit, age=....) to take control over the range of age plotted.
To your main question, it is not a good idea to “play” with the knots as then the confidence intervals no longer apply. And these are not “cutoffs” but are points at which the 3rd derivative of the curve is allowed to abruptly change. Use default knot placement and select 3, 4, or 5 knots depending on your effective sample size. Model as flexibly as the sample size will allow but pre-specify the number of knots. The RMS book and course notes goes more into knot specification.
Thank you Professor Harrell, I have been reading your course notes extensively in recent months and found how naive I was in developing prediction model.
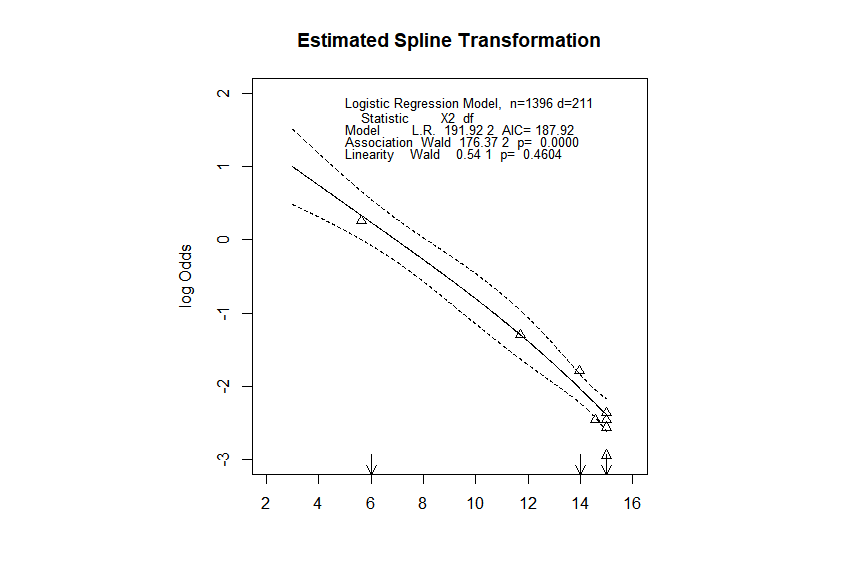
I also used rcspline.plot function to look at the GCS (Glasgow Coma Scale) with the mortality for the patients. After looking at the results, should I applied it as a continous variable for prediction. I am not so sure and cannot find a example for interpretation of the results, does the linearity wald test for a p>0.05, indicates the rejection of the H0 hypothesis: the relationship of GCS and logit mortality is not linear?
rcspline.plot(data$EDGCS, as.numeric(data$M6MLog)-1, model=“logistic”, nk = 5, showknots=TRUE,
noprint=FALSE, show=“xbeta”, m=140)
And is there a way to take control over the range of GCS and increment being plotted in rcspline.plot function as well?
You should have seen the whole range on the x-axis. If not you might play with the ylim argument to the plot method. Also note there is a ggplot method and a plotly method, called plotp for interactive graphics. And use rcs instead of rcspline.plot.
Thank you so much Professor Harrell, and do you think I should use the GCS as a continous variable here for my prediction model? Because some clinicians suggest to use them as mild (GCS 13-15), moderate (9-12) and severe (GCS 3-8) instead.
Get it. Thank you for your suggestion:)
And just to make sure I get it right here, use it as a quadratic polynomial means to use it with the rcs function with 3 knot?
No, I meant a regular quadratic. In the R rms package this is pol(glasgowComaScore, 2). The reason I’d use a quadratic for a scale that is fairly discrete is that it’s too hard to pick knot locations with a lot of ties in the data.
Thank you, I guess my main problem is with the transformation of continous and scale in my model and how to explain the coefficients of them. I am also using lasso as a comparative methods with the traditional backward stepwise.