That is true and for some reason (as can be seen from this thread) the frequentist assumptions seem quite unfamiliar to non-methodologists.
1 Like
A recent issue of Science has a book review (by Sorin Krammer) of a new book I have not seen, Proof: The Art and Science of Certainty, by Adam Kucharski. According to the reviewer, the book argues “that the tools we have constructed to pursue certainty–logic, statistics, experimentation, and artificial intelligence–systematically embed the very biases and constraints they originally sought to transcend.”
Further,
Kucharski ends with a call to embrace methodological pluralism and to acknowledge that proof is a social, dynamic, and often contested act. Rather than searching for ultimate, irrefutable arguments, he advocates for triangulation by using independent, sometimes imperfect methods to converge on truth. This insight is likely the book’s most enduring contribution.
Has anyone here read this book?
3 Likes
Critiques that emphasize the biases inherent in statistics, or experiments risk throwing the baby out with the bathwater. These methods are indeed imperfect, but their value lies precisely in making assumptions explicit, in structuring uncertainty, and in offering ways to test and correct errors. To dismiss them because they fall short of “proof” is to replace imperfect tools with no tools at all, leaving us only with intuition, rhetoric, or authority—far less reliable guides. Progress in science has always come from refining fallible methods, not from abandoning them.
1 Like
The whole problem is that this is not happening, despite decades of exhortations to this effect. If a researcher makes his assumptions explicit, he will be admitting that his results are much more uncertain than his “confidence intervals” suggest- and nobody will want to publish his study. So he buries (ignores) the assumptions and asserts, with confidence, in clinical journals and the media, that he has made an important “discovery.” He is implying that his very tentative (or exploratory) findings should directly affect clinical decision-making. Sadly, the problem is so engrained in our research ecosystem that many (?most) researchers today aren’t even aware of the assumptions they’re burying…
Suhail: Patients present to physicians every day with symptoms that are making them miserable. They want relief from their symptoms and they want to live longer and happier lives. The physician makes a diagnosis, then, hopefully, recommends a therapy that has been approved by a regulatory agency because it has demonstrated intrinsic efficacy, in RCTs, for improving patients’ symptoms or outcomes. Meanwhile, JAMA has been howling every month over the past 10 years about how one database study or another has showed that this same medication is “associated with” (read “causes” by everyone on the planet) cancer, dementia, heart attack, erectile dysfunction, depression,….Patients ask doctors, EVERY SINGLE DAY, about these observational studies that have been splashed across the news headlines. If you think that I have 5 hours to “critically appraise” all those observational studies in front of my patient (and explain why half of statisticians don’t believe that confidence intervals from observational studies are even interpretable, while the other half does), think again…How the heck is the doctor supposed to help anyone effectively in this environment ?? Please tell me- I’d love to hear your suggestions.
We can talk til the cows come home about not “throwing the baby out with the bathwater.” I agree with this nebulous statement, in principle. But please tell me, precisely, how I can save the baby and still remain sane while practising medicine…
2 Likes
The discussion so far has focussed on causal bias that occurs during observational studies (and also RCTs). The point has been well made by @ESMD that in order to interpret a confidence interval, potential sources of bias should also be made explicit and if possible controlled for in the methods or compensated for rationally for known covariates (e.g., by a summarising Bayesian prior distribution). This could apply to the confidence intervals of ‘true’ effect sizes or risk ratios or odds ratios. Perhaps we have to assume that the effect of random unknown covariates have no net effect on the mean and can be assumed to be represented by the width of the confidence interval. However, if these issues are not addressed carefully, then as @ESMD points out, the confidence interval is meaningless. and in the case of observational studies, perhaps impossible to be made meaningful.
Bias in the form of inaccurate probabilities can also occur during clinical application of study results to an individual patient when estimating absolute risk reduction due to treatment. It is standard EBM practice to use the expected ‘point’ risk ratio or odds ratio to estimate the average absolute risk reduction from the trial and to apply this to the individual patient based on the baseline risk. However, the clinician must also take steps to exclude other ‘causes’ (e.g. by doing an MSU to ‘exclude’ a UTI as a potential cause when investigating proteinuria in an individual patients). Many covariate values in an individual may influence the baseline risk, but from my clinical viewpoint, it is the disease severity that is dominant. After all at a disease severity of zero (i.e. there is no disease) or near zero, the ‘baseline’ probability of an adverse outcome from that disease is so low that treatment is unlikely to help.
The IRMA2 RCT assessed the effect of adding an angiotensin receptor blocker (ARB) on the frequency of developing of nephropathy. The average risk of nephropathy within 2 years was about 15% on control and about 7.5% on treatment giving an expected risk ratio of 0.5, the average absolute risk reduction (ARR) being 15% - 7.5% = 7.5%. However, patients were recruited with an albumin excretion rate between 20 and 200mcg/min. Figure 1 shows the frequency of nephropathy within 2 years at five different ranges of AER. In the AER range 20 to 40mcg/min, only 1 out of 77 developed nephropathy, reducing to 1/127 on treatment giving a point estimate ARR of 0.5%. Thus 77/196 = 39% of those treated would have about a 0.05% chance of benefiting.
Figure 1: ‘Stratifying’ RCT results based on disease severity of Diabetic Albuminuria (i.e., the albumin excretion rate)
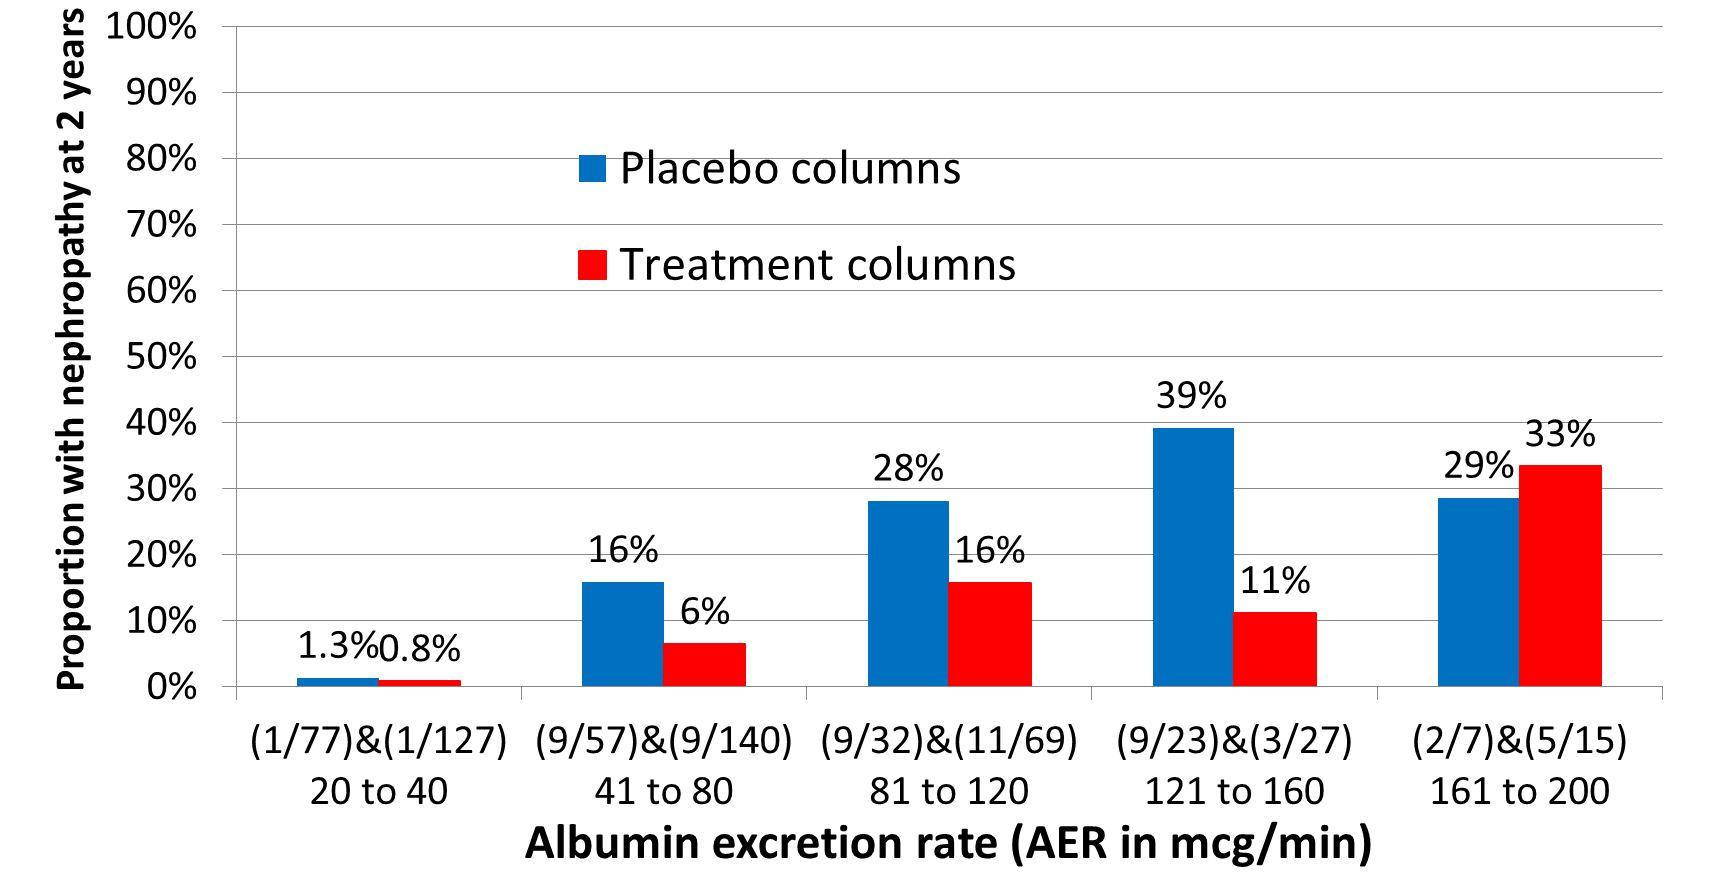
The current practice of applying the average risk reduction in a trial to an individual patients regardless of disease severity represents a gross exaggeration of effectiveness in the biggest group of patients with mild disease. This would be very misleading during shared decision making and lead to unwarranted treatment. This practice is widespread, and a major cause of over-diagnosis and over-treatment. To an experienced physician, disease severity is a very important part of diagnosis and alongside drug dosage, the dominant cause of treatment heterogeneity. However, these ‘treated’ patients would continue to remain free of the target adverse outcome and be regarded as treatment successes due to ‘early diagnosis’.
1 Like
Erin, clinical decision making should be grounded in the understanding that no single trial or observational study provides a final answer, but rather each contributes incrementally to the cumulative body of evidence. As we have argued, science is inherently cumulative and the role of primary research is to add to the broader picture rather than to settle questions outright. You gave the example of PPIs and dementia – maybe that is true and maybe that is false, but it is not the physicians job to ponder over such uncertainties. If my patient brought this up, I would simply say that we should view this research as a contribution towards the accumulation of evidence on, rather than a means towards the conclusive answer to any such question and it would be premature to act on any single piece of evidence till there is accumulated data that we can make sense of.
In this framework, uncertainty intervals are not mere statistical add-ons or conclusiveness generators, rather they are tools: they make transparent the degree of imprecision in each estimate, highlighting that any given study represents only one piece of a larger puzzle. A wide interval signals that findings must be interpreted cautiously and in conjunction with other studies, while narrower intervals indicate greater stability but still require contextualization within the evolving evidence base. By focusing on how uncertainty intervals from diverse studies overlap, shift, and narrow as evidence accumulates, physicians can better appreciate when knowledge is converging toward reliability versus when it remains provisional. Thus, the integration of uncertainty intervals into cumulative evidence synthesis provides a disciplined approach for clinicians to move beyond reacting to single publications and toward making decisions that respect both the strengths and limitations of the scientific process.
1 Like
Huw, we need to move the average treatment effect from a trial towards the closest empiric treatment effect that applies to more than just the average person and that is why covariate adjustment is needed in RCTs. For example, if sex is prognostic for the outcome, then the trial analysis should adjust for sex otherwise the results do not apply to men, do not apply to women and simply apply to people whose sex is a hybrid of the percentage make up of the group by sex in the dataset.
The problem here is I said adjustment of the analysis. How about if we stratify by gender (assuming there is enough data) aka subgroup analysis? The problem with the latter is that it no longer applies to the whole dataset and incorporates artifacts of the sample because subgroups are akin to a fully saturated model.
So Huw, perhaps you could compare stratification by disease severity with adjustment for disease severity and tell us if the adjusted effect could better accommodate the empiric effect of treatment i.e. apply to a person of any severity? And perhaps use the odds ratio in the example as over the years I am getting more uncomfortable with risk based binary effects in the primary analysis.
1 Like
With respect, Suhail, how is it “not my job” to ponder such uncertainties when, as a family physician, multiple patients flood my office after studies like this are published, asking for my opinion on them (??!) This actually happened! And how is it “not my job” if a patient with severe GERD symptoms and multiple risk factors for esophageal cancer is considering allowing studies like this to guide his decision-making (??!) If it’s “not my job” to ponder such uncertainties, then why are findings like this being published in clinical journals and trumpeted by universities to news outlets? It’s maddeningly obvious that researchers who publish these types of studies have no idea how much “real-world chaos” they create by over-interpreting their own results.
Physicians are more than capable of understanding these uncertainties, but very few patients (the ultimate “deciders”) will have the education/training to treat them with the nuance and skepticism they deserve.
2 Likes
Huw
Clinical decision-making will always be imperfect. We all have to do the best we can. As argued in this thread, putting too much stock in observational evidence of treatment harm can potentially lead to suboptimal clinical decision-making. But it’s also true that not every patient will benefit meaningfully when we prescribe therapies with RCT evidence for efficacy.
If we accept that not everyone will benefit meaningfully from the therapies we prescribe (even when those therapies have RCT evidence of efficacy), then we might argue that it could sometimes be reasonable to be swayed by even uncertain evidence that the same therapy might pose unanticipated risks. This is where clinical context and nuanced decision-making become very important.
Factors that could undermine our expectation of a meaningful therapeutic benefit for the patient in front of us might include 1) a low estimated baseline risk for the outcome we’re trying to prevent with therapy (a consideration that’s most relevant when we’re trying to prevent or slow the progression of disease); 2) a clinically unimpressive yet “statistically significant” benefit (in relative terms) for the therapy in the RCTs that underpinned its regulatory approval; or 3) an unjustified assumption about the transportability of the relative treatment effect from the RCT convenience sample to the patient in front of us.
Let’s consider factors 1-3 above and how they can, in practical terms, get “slotted in” to daily medical decision-making/practice.
Re factor 3) above: Clinicians assume transportability of RCT effects every day in situations where the causal mechanisms for development of a disease are well understood and considered to be fairly homogeneous across patients. For example, we have a good understanding of the cause of STEMI, but a poor understanding of the cause(s) of depression. Therefore, we feel confident applying the same treatment to all patients with STEMI, but less confident in treating all patients with symptoms of depression in the same way.
Re factor 2) above: When a small relative benefit underpins the approval of a therapy, it becomes even more important to consider whether we’re trying, with our treatment, to prevent important disease in a patient who is currently well or alleviate important symptoms in a person who is sick. This distinction matters.
In general, our threshold for prescribing to alleviate active symptoms, using therapies with RCT evidence of efficacy, will be lower than our threshold for prescribing for preventive purposes. These are the scenarios for which the “noise” generated by hyped observational studies touting harm signals becomes becomes so frustrating. If we’re faced with a patient with active suffering and we have, available to us, a therapy that has been shown, in RCTs, to have intrinsic efficacy, and we have no other efficacious, safe, and accessible treatment options, why in the world would we be dissuaded from using it because of some weak and highly uncertain observational study signal for possible therapeutic harm in the distant future?
If we’re trying to reduce the risk of important disease using a therapy with only a small demonstrated relative benefit in RCTs, we will ideally first try to estimate the patient’s absolute baseline risk for the outcome we’re trying to prevent with the therapy, then try to estimate how much that risk might decrease with treatment. Unfortunately, however, risk calculators only exist for a very very small subset of all the clinical decisions we need to make in daily practice. We also need to consider competing comorbidities/pill burden/therapy cost/potential drug interactions etc. Very often, this subjective (and admittedly very crude) global assessment of “pros versus cons” of a therapy for the particular patient in front of us will cause us to forgo the addition of a therapy, even one with RCT evidence of intrinsic efficacy- and this decision can be totally appropriate.
Re factor 1) above: this seems to be a personal interest of yours. In general, you seem to feel that much of our prescribing is unnecessary because the baseline risk of adverse outcomes without therapy is, for many conditions, lower than is commonly thought. I infer that you have concluded that overprescribing is therefore rampant in medicine. You seem to want to prove this mathematically. I don’t understand your math, but agree that many medications are over-prescribed and that physicians need to be vigilant in order to avoid this trap. However, since it’s arguably also true that egregious under-prescribing exists for some conditions/patient populations, I don’t support a black-and-white/ideological position on this issue. My main objection to your efforts to use math to try to show that overprescribing is rampant is that no physician would ever have the time to apply these kinds of complex risk estimation methods in daily practice. The time and effort involved would simply not be commensurate with the sheer volume and mandated speed of clinical decision-making.
I do not mean that you should not give patients a response, I mean that the response should be that this is not a decision making study and we should wait for consensus. Until then what I say is that not every single study or report gives us a complete picture. Sometimes, a single study shows something unusual that later turns out not to be true. That’s why doctors don’t make changes based on just one finding. We look for patterns—when multiple studies over time point in the same direction—before deciding if something is important for your care. The broader question of findings like this being published in clinical journals is to allow evidence to accumulate and these findings are trumpeted by universities to news outlets for social and not scientific reasons.
For example, as Ben Goldacre has said, there are studies that conclude that coffee is either a risk factor or a protective factor for cancer. Cumulative evidence supports neither and therefore coffee drinking continues. If we did not have the cumulative evidence, would one study stop me from coffee?
Final note is that in the face of such studies, patients will usually ask what the physician will advise and usually agree. If they do not, that is patient preference and they have every right to ask for something else, even if they are rejecting a well proven therapy. You have done your job - let the patient make his/her decision. I think your frustration is why cant a patient understand that I am protecting their health - well our job is advisory not enforcement of what we think is in their best interests.
3 Likes
Suhail- I can agree with most of this. My point is that there is a glaring disconnect between your nuanced stance here and how these studies are presented by clinical journals and the media. Perverse incentives for publication and career advancement have profoundly, and apparently irrevocably, affected the way that scientific evidence is disseminated and internalized.
That study conclusion cited in post #91 above was egregiously over-interpreted and had a significant impact on physicians and patients at the time- ask any family physician or gastroenterologist. If these types of studies are going to continue appearing in clinical journals, I’d suggest, at the very least, that your caveat be inserted at the beginning of every abstract: “This is not a decision-making study.” And I agree that most patients will understand the limitations of such studies when I explain them. But not all will. Some, as a result, will make a decision that could end up harming them in the end. And this bothers me, because I don’t want my patients to be harmed. Yes, I’ve done my due diligence if I explain everything to them and they still decline treatment. But the fact that weak evidence has ultimately led someone to make a poor decision is still not a desirable outcome.
3 Likes
‘Over-diagnosis and over-treatment’ is now a well recognised phenomenon and driven by shiny new blood tests and imaging supported by AI that pick up subtle changes. Many of these findings will not change or will regress and are innocent. If these are treated then the outcome is inevitably good and the success is claimed to be due to early diagnosis and early treatment. However such diagnoses and treatments can cause harm without benefit as the test result poses no danger. The only way to solve the problem is to design studies along the lines of IRMA-2 above.
If this is done, then the threshold for test results or shadow size on imaging for considering treatment might be changed to exclude those with little prospect of benefit. The threshold for albumin excretion rate was established using two upper standard deviations of the log of the albumin excretion rate, implying that 2.5% of the studied population was ‘abnormal’. Something similar is done for all tests, which is naive.
Once a test result is above some more sensible threshold (no math required), then a primary care physician can refer to a specialist who may wish to engage in shared decision making with the patient before deciding on a treatment strategy. This might involve Decision Analysis that will require various probability estimates that are as accurate as possible. RCTs like the IRMA-2 study will be needed to establish these probabilities. In my view, it is essential that future clinicians who wished to be engaged in research understand the common sense concepts of probability theory of diagnosis and treatment and how they are applied to decisions.
1 Like
I don’t think anyone here has dismissed observational studies themselves. They are crucial for learning about our world. David Freedman’s 2008 paper shows how they can be used successfully, and there is no one size fits all method for doing so, no recipe or procedure. I am guilty of working with many observational studies myself and even reporting UIs for them. What we are discussing in this thread is the interpretability of these UIs. Somehow there is uncertainty here that is not being conveyed in the (frequentist) mathematical output; it must be therefore be conveyed qualitatively/narratively, and I agree with you and @ESMD that this nuance gets completely lost in the press releases and news reports that reach the public.
6 Likes
Very well said Chris. It would also be useful, and perhaps imperative, to completely separate designed prospective OS from non-designed retrospective OS based on free convenience data. Very little good comes from the latter but the former often provides useful information that even can lead to reliable decisions about medical practice. A key characteristic necessary for a study to be called designed is that unbiased experts are polled before data collection to determine the variables likely used in decision making (e.g. confounders by indication), and study designers make sure those variables are collected with virtually no missing data and minimal errors. Strong prognostic variables are also pre-determined and well-collected, and design also has everything to do with how response variables are measured, collected, and their determinations blinded.
5 Likes
Addendum, added design features from Frank’s post to the table
Agree with that. I am going to try to summarize this entire thread and answer the question in the first post. Please feel free to criticize freely:
Summary:
The 95% uncertainty (confidence) interval is the range of test hypotheses whose predicted distributions would include the study’s observed data within their central 95%, and that remain plausible for the study’s target of estimation. A test hypothesis is a probability model of a population that could have generated the observed study data. The phrase “plausible for the study’s target of estimation” means that the interval reflects uncertainty around the populations that could have produced the study data, even if the target quantity the study was set up to estimate is not exactly what the authors intended or may be far from the true population value. In practice, we never know whether the target is perfectly on-point or somewhat off-point. What matters is that imprecise intervals rarely change decisions, because the wide range of plausible values already makes the evidence weak. But when an interval is narrow, its clinical impact depends critically on whether the target is well chosen: if so, it provides a trustworthy estimate of the right thing; if not, it risks giving the false impression of certainty about the wrong thing. For this reason, a single precise interval should not be treated as decisive for patient care. Its proper role is as a contribution to the accumulation of evidence, where multiple studies, examined together, clarify whether the target was well chosen and whether the estimate consistently points in one direction before being used to guide clinical decisions.
Decision scenarios for interpreting uncertainty intervals
| Interval type | Practical meaning | Clinical utility | Design features that support target plausibility |
|---|---|---|---|
| Imprecise (whether target on- or off-point) | Wide interval → many possible population models could explain the data. Target status matters little because uncertainty is already overwhelming. | Rarely useful for patient decisions; mainly contributes to cumulative evidence. | Any design may generate imprecise intervals; low power or small sample size is typical. |
| Precise + Target likely plausible | Narrow interval and the study design, population, and outcome make the target a reasonable representation of the clinical quantity of interest. | Useful for decision-making, especially when consistent with other evidence. Still best interpreted as one piece of accumulating evidence. | Randomized controlled trials (RCTs), well-designed large cohort studies, representative populations, clearly defined patient-centered outcomes, pre-specified endpoints, high-quality measurement. |
| Precise + Target likely implausible | Narrow interval but study design, population, or outcome suggest the target is misaligned with the true clinical question. | Potentially misleading: a precise estimate of the wrong thing. Should not drive clinical action alone; wait for cumulative evidence. | Observational studies prone to confounding or selection bias, surrogate outcomes rather than patient-centered outcomes, unrepresentative populations, post-hoc analyses, poorly measured outcomes. |
1 Like
Sorry, Suhail, but the way you have summarized this thread is not at all how I would have summarized it.
The whole reason I started this thread was because I couldn’t reconcile the following ideas: 1) the “95% confidence interval” is a frequentist concept for which valid interpretation seems to require either random sampling to determine which members of a population will be included in a study or random allocation of subjects in a convenience sample to one treatment or another; and 2) there is no random process anywhere in the conduct of an observational study.
Given 2) above, I asked why it’s considered kosher to put a 95% confidence interval around an observational study’s point estimate.
Your summary, as I read it, seems to be licensing the status quo in terms of how confidence intervals are interpreted. But there are clearly other experts who don’t accept the status quo as valid. These differences of opinion seem very problematic- to me at least.
2 Likes
Thank you Suhail. There is a lot to unpack in your comments and that there are many levels of complexity that could be addressed. My main point is that setting of thresholds for treatment decisions based on a test’s ‘normal range’ is not a good idea.
When I looked at the data originally the proportion of males and females were similar in those with and without nephropathy and the initial distribution of BP was similar before and after randomisation in those with and without nephropathy later. The overwhelming predictor of nephropathy was the initial ‘severity’ of the proteinuria as measured by the albumin excretion rate (AER).
I fitted logistic regression curves to the probabilities / odds of nephropathy for the 5 strata conditional on the AERs for placebo and treatment and showed that the odds ratio and risk ratio varied with severity both being about 0.7 at 20mcg/min but diverging markedly at higher levels of AER the OR being parabolic in shape but the RR falling progressively.
The baseline risk of nephropathy rose steeply with increase of pre-treatment AER. Predictably, the risk difference was very low below 40mcg/min, maximal around 145mcg/min, then dropping off.
I agree that there is much more to explore by incorporating other covariates. My current concern is persuading my clinical and research colleagues and the EBM community of this and that disease severity is a very important and perhaps a dominant ‘core’ covariate.
1 Like
Huw, of course disease severity is important. My point is that this is easily solved by an adjustment of the OR of the intervention effect by the five categories of severity (AER) and use of that adjusted OR as the severity independent closest empiric estimate of treatment effect. Hence in this trial covariate adjustment is important (regardless of balance of covariates at baseline) and will mitigate what you have shown (risk magnification). Since you are using categories of severity for adjustment, you need not worry about the shape of the stratified curves.
Hi Erin, that summary table incorporates all opinions on this thread. If you do not think so, please specify which statement in the table fails to incorporate the diversity of opinions we had.
What is missing is a column labeled “justification”. For an RCT or designed survey, a frequentist would put random allocation and random assignment, respectively, and these are only approximate, strictly speaking. (You can add yet another column for “Bayesian justification” if you like-- I leave it to the Bayesians to fill in that one.) For an OS I would put a big red question mark under the frequentist justification column.
2 Likes