Background
I have a situation where I have data on bank balances of various respondents, and a flag for whether they completed a desired action (i.e., whether they purchased a loan or not). The data on savings/money has been discretised, however.
Problem statement
A concern has been raised that the bank balances of respondents might not be the actual ones, but updated (updated bank balance = original balance + loaned amount).
How to verify this? I have tried formulating an approach below.
Solution formulation
Since I only have discretised data, I thought I could set up a statistical hypothesis test for proportions.
Hypothesis: If the proportion of success/loan purchasers increases drastically as we move up higher in account balance groups, it would indicate the balances are inclusive of loans.
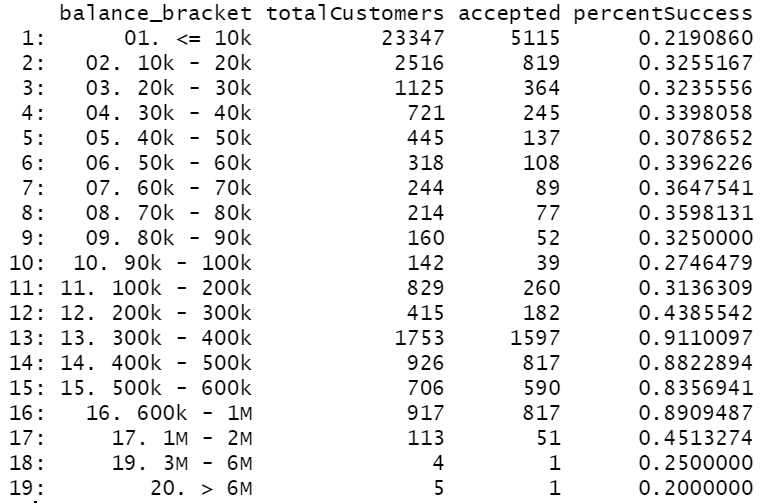
As shown in the image, there is an unexpected increase in success rate, and at this point, it seems no statistical test is needed?
My questions:
- Is the aforesaid sufficient evidence? How can I make it more thorough (statistically), assuming I will not get the actual balances?
- If I did get actual balances, how can I gather evidence to verify that there is/is not a group of people whose balances are inflated due to loan amount
I am extremely interested in understanding Stats. application to such problems, and understanding the Statistical theory, so I would be indebted to understand the wrongs of my way.
Data
structure(list(finalClass = c("Reject/Cancel", "Success", "Reject/Cancel",
"Success", "Success", "Reject/Cancel", "Reject/Cancel", "Success",
"Reject/Cancel", "Success", "Reject/Cancel", "Success", "Reject/Cancel",
"Success", "Success", "Reject/Cancel", "Success", "Reject/Cancel",
"Reject/Cancel", "Success", "Reject/Cancel", "Success", "Reject/Cancel",
"Success", "Success", "Reject/Cancel", "Reject/Cancel", "Success",
"Success", "Reject/Cancel", "Success", "Reject/Cancel", "Success",
"Reject/Cancel", "Reject/Cancel", "Success", "Reject/Cancel",
"Reject/Cancel", "Success"), balance_new_bracket = c("01. <= 10k",
"01. <= 10k", "02. 10k - 20k", "02. 10k - 20k", "03. 20k - 30k",
"03. 20k - 30k", "04. 30k - 40k", "04. 30k - 40k", "05. 40k - 50k",
"05. 40k - 50k", "06. 50k - 60k", "06. 50k - 60k", "07. 60k - 70k",
"07. 60k - 70k", "08. 70k - 80k", "08. 70k - 80k", "09. 80k - 90k",
"09. 80k - 90k", "10. 90k - 100k", "10. 90k - 100k", "11. 100k - 200k",
"11. 100k - 200k", "12. 200k - 300k", "12. 200k - 300k", "13. 300k - 400k",
"13. 300k - 400k", "14. 400k - 500k", "14. 400k - 500k", "15. 500k - 600k",
"15. 500k - 600k", "16. 600k - 1M", "16. 600k - 1M", "17. 1M - 2M",
"17. 1M - 2M", "18. 2M - 3M", "19. 3M - 6M", "19. 3M - 6M", "20. > 6M",
"20. > 6M"), N = c(18232L, 5115L, 1697L, 819L, 364L, 761L, 476L,
245L, 308L, 137L, 210L, 108L, 155L, 89L, 77L, 137L, 52L, 108L,
103L, 39L, 569L, 260L, 233L, 182L, 1597L, 156L, 109L, 817L, 590L,
116L, 817L, 100L, 51L, 62L, 9L, 1L, 3L, 4L, 1L), percent = c(0.780914036064591,
0.219085963935409, 0.674483306836248, 0.325516693163752, 0.323555555555556,
0.676444444444444, 0.660194174757282, 0.339805825242718, 0.692134831460674,
0.307865168539326, 0.660377358490566, 0.339622641509434, 0.635245901639344,
0.364754098360656, 0.35981308411215, 0.64018691588785, 0.325,
0.675, 0.725352112676056, 0.274647887323944, 0.686369119420989,
0.313630880579011, 0.56144578313253, 0.43855421686747, 0.911009697661152,
0.0889903023388477, 0.117710583153348, 0.882289416846652, 0.835694050991501,
0.164305949008499, 0.890948745910578, 0.109051254089422, 0.451327433628319,
0.548672566371681, 1, 0.25, 0.75, 0.8, 0.2), tots = c(23347L,
23347L, 2516L, 2516L, 1125L, 1125L, 721L, 721L, 445L, 445L, 318L,
318L, 244L, 244L, 214L, 214L, 160L, 160L, 142L, 142L, 829L, 829L,
415L, 415L, 1753L, 1753L, 926L, 926L, 706L, 706L, 917L, 917L,
113L, 113L, 9L, 4L, 4L, 5L, 5L), conf_low = c(0.775552136317493,
0.213794081502295, 0.65578046562415, 0.307220804467065, 0.296264735635882,
0.648227521218143, 0.624326658051425, 0.305255642604346, 0.646947176024304,
0.265253980427813, 0.60544358384926, 0.287709357961987, 0.571443652323727,
0.304282016481803, 0.295522603420615, 0.571952527712148, 0.25317409400087,
0.596551368545636, 0.64420157566435, 0.203150823708409, 0.653560936603063,
0.282154345692913, 0.51220524670192, 0.390195953557052, 0.896698056863425,
0.076072772673856, 0.0976559949418072, 0.859767702403072, 0.80626156910148,
0.137713232814479, 0.868959355941994, 0.0896127959455879, 0.357541357583628,
0.452272456810347, 0.663732883120057, 0.00630946320970987, 0.194120449683243,
0.283582063881911, 0.00505076337946806), conf_hi = c(0.786205918497705,
0.224447863682507, 0.692779195532935, 0.34421953437585, 0.351772478781857,
0.703735264364118, 0.694744357395654, 0.375673341948575, 0.734746019572187,
0.353052823975696, 0.712290642038013, 0.39455641615074, 0.695717983518197,
0.428556347676273, 0.428047472287852, 0.704477396579385, 0.403448631454364,
0.74682590599913, 0.796849176291591, 0.35579842433565, 0.717845654307087,
0.346439063396937, 0.609804046442948, 0.48779475329808, 0.923927227326144,
0.103301943136575, 0.140232297596928, 0.902344005058193, 0.862286767185521,
0.19373843089852, 0.910387204054412, 0.131040644058006, 0.547727543189653,
0.642458642416372, 1, 0.805879550316757, 0.99369053679029, 0.994949236620532,
0.716417936118089)), row.names = c(NA, -39L), class = "data.frame")
PS. This is a cross-post from Twitter, where I tried having a discussion about this (and Frank Harrell kindly advised on getting actual balances) but I realised it is a lengthy one, not suitable to Twitter.