Illness Severity among Non-COVID patients

Background
Since the beginning of the pandemic, several anecdotal reports of Non-COVID patients presenting to Emergency services (both prehospital and hospital) with more severe disease have been received. The concern is that in an effort to avoid overloading the healthcare system, or due to fear of contracting COVID while at the hospital, patients may be waiting longer to access care for acute medical problems. This may have short-term implications on the successful management of their acute illness (i.e. progression of their disease) that may also impact an already strained healthcare system (i.e. requirement for more intensive therapy and hospitalization).

Objectives
The primary objective of this study is to assess the illness severity among Non-COVID patients.
Secondary objectives include assessing the spectrum of illness of suspected COVID patients presenting to Emergency services over the outbreak.

PICO
Population: All patients presenting to the Emergency Department (ED) directly, or via Emergency Medical Services (EMS) in a single City (Calgary, Alberta, Canada). These patients will be stratified into suspected COVID vs. Non-COVID based on a novel ED code indicating the same. COVID case and mortality statistics available here
Exposure: Period since physical distancing recommendations instituted by Public Health
Comparison: Same period for prior 2 years
Outcome: Critical Illness Prediction Score (CIP)

  • This score uses presenting vital sign measures to quantify a patient’s Illness Severity on a scale from 0-8

  • It has been validated as a general measure of illness severity for predicting hospital mortality among Emergency patients, both trauma medical

Secondary Outcomes:

  1. Death in ED or per EMS
  • This outcome is both clinically relevant and will help overcome one of the limitations of the Critical Illness Prediction score; worse discrimination and calibration for short-term outcomes.
  1. Emergency Department Disposition
  • This will be an ordinal outcome of Death in ED, Admission to Intensive Care, Admission to Hospital, or Discharge Home

Patient Records
EMS and ED records will be used, representing all patients accessing emergency care in the Metropolitan area (including those who are not transported to hospital). These records will be linked using a validated linkage strategy.

Analysis
Visual displays of the mean illness severity score over time (see example from test analysis below), and rates for secondary outcome will be presented.


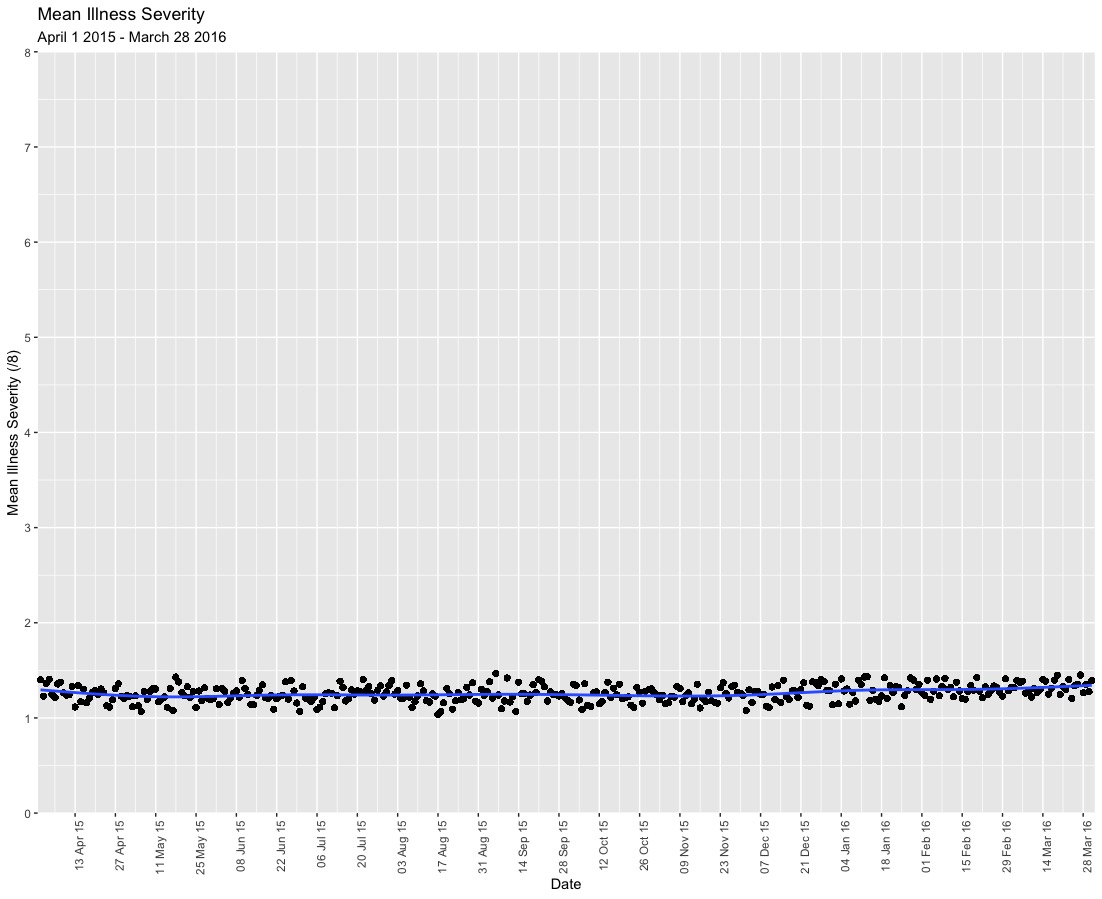
The primary analysis will use a hierarchical Bayesian interrupted time-series to assess change in the ordinal outcome of the illness severity score over time. Patients will be restricted to Non-COVID patients.

Proposed Model
CIP = β°+ β1 * Time (Site) + β2 * COVID (Site,Time) + β3 * Time * COVID

  • CIP is the ordinal outcome score (0-8)

  • β° = the average illness severity at Time = 0

  • β1 = the change in Illness severity. Days will be the unit of time.

  • β2 = change in Illness severity following public health recommendations

  • β3 = any change in illness severity over course of time while recommendations are in place

  • Site = clustering variable for hospital site (There are 4 ED, 1 urgent care centre, and a final cluster for patients not transported by EMS)

  • Time = days over study timeline. Also a random-effect per site.

A cumulative model for the ordinal outcome will be used, which is meant to represent a continuous distribution of illness severity that is informed by the discrete score. Clustering by site will allow us to simultaneously estimate the within-hospital variation and between-hospital variation in the outcomes over time, which may change with the patient illness severity and pandemic response. The use of several years of historical control data will allow for appropriate estimation of baseline rates while accounting for seasonal trends. In preliminary analyses, linearity of time with illness severity was maintained; however, a Bayesian spline function will be use to model non-linearity should any exist. Days will be used as the unit of time to allow for sufficient granularity.

Results will be presented as the probability of a change in illness severity (i.e. Probability β2 > 0). The magnitude of change will be reported as standard deviations on the latent scale of the illness severity measure as this is what the effect estimates represent. Finally we can estimate the change in probability of hospital mortality, associated with any change in illness severity, using coefficients for this association reported previously.

For the secondary outcome of ED mortality we will report the change in probability of mortality , and change in disposition status during the COVID pandemic.

Sensitivity Analyses:
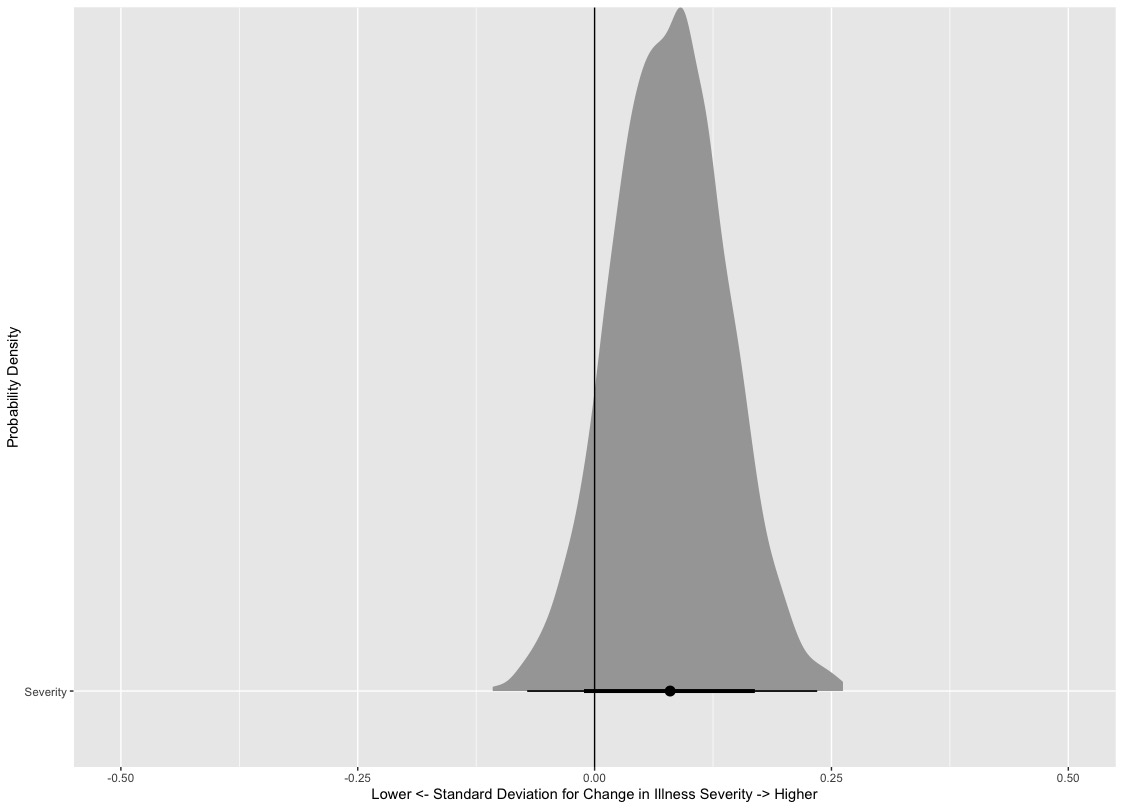
To assess our hypothesis that social pressure may be encouraging patients to delay when they present to Emergency services for acute medical needs, the Illness Severity during the COVID period will be contrasted with Non-COVID events that may present similar (albeit more joyful) social pressure to delay accessing emergency care. These events will include Christmas Eve and Day, New Years Eve and Day, Good Friday and Easter Sunday during the period prior to the COVID-19 Pandemic.
In a test of this Sensitivity Analysis, the probability of Increased Illness Severity on these days compared the the rest of the year was found to be 0.91 (posterior distribution shown below).

This analysis was informed by:

  1. Paul-Christian Burkner’s tutorial on Ordinal Regression

  2. Solomon Kurz’s blog post on Time-varying covariates in longitudinal analysis

4 Likes

Dan you have really thought this through. Most impressive. My only comment is whether the 0-8 ordinal scale has sufficient discrimination to detect the changes you are studying. For example does the scale distinguish a serum creatinine of 1.75 from a 2.25 from a 2.75? Does the scale exclude age (I hope it does)? Does it give sufficient weight to all levels of mean arterial blood pressure?

Thank you for your feedback @f2harrell
The major limitation of this study will be the illness severity measure. The measure selected categorizes many of the clinical predictors, including age, in order to generate a score. Here is the original publication that shows the thresholds in Table 2. While I recognize there is information lost by adopting such a score, we require a measure that can represent illness severity among a large and general (i.e. mixed) patient population. In the validation study this score had moderate discrimination (C = 0.79 for hospital mortality, C = 0.85 for 2 day mortality) and good calibration. An alternative score that uses similar clinical measures, more thresholds, and excludes age (NEWS score) was found had similar discrimination and calibration, but it had a smaller calibration range (did not identify highest risk patients) and therefore was felt to be limited compared to the selected score in terms of its measurement properties.
Alternative illness severity measures might include the SOFA or APACHE scores, but these require laboratory measures that are not available in all patients and therefore would introduce a selection bias if we used them as a primary outcome.
Given the primary objective for this study is to assess changes in illness severity over time, my thoughts are the most important component of the measure is its reliability over time. I take the good calibration to be a sign of the score’s reliability in this regard. This score seems very stable in preliminary analyses (shown above), so with a large enough population (anticipating 420,000 patients) and a Bayesian random-effects analysis, I am expecting to be able to detect a signal for any changes in illness severity despite the information loss.
However, I would welcome thoughts on this trade-off, or any alternative suggestions for measuring illness severity.

2 Likes

Dr Harrell, why would we want this scale to exclude age? Given the intended use case, which is at the front-end of the care process, it seems likely (to me) that age could serve as a proxy for other factors that were not known or knowable at the time of patient scoring.

I would adjust for age and take it out of the score. You don’t want to make severity of illness look worse just because a sample is older, for example.

I do worry about the courseness of the severity measure. As Andrew Gelman has demonstrated you can see time trends that are not real (although his example was more the result of coarseness in an adjustment variable). I am not convinced that the validation study was really a validation study. A true validation study needs to include a demonstration that the score is not beat by other scores whose components are feasible to collect. And the APACHE III score uses routine lab data (except for the blood gas portion, which is less often ordered).

It would be a shame if the lower resolution severity score were to be beat in predictive discrimination by serum creatinine by itself.

1 Like

I will do this - may help improve the discrimination of the score too if some variation is explained by differences in age.

Agreed, this is my main concern too.

The goal of the sensitivity analyses will be to examine for consistency of the signal with other indicators. We can look at the alternative score (NEWS), and ED disposition. We are also collecting lab data and can calculate APACHE III but as mentioned, my may concern with this measure is the inherent selection bias for missing data among less severe patients. Multiple imputation may help.

The developer of APACHE, Bill Knaus and I had a grant many years ago to study optimal imputation procedures for ICU patients. We found that physicians so good at ordering tests that better than imputation was to insert super-normal values for labs. Super-normal values were estimated by fitting splines to each lab variable and determine the point at which ICU mortality was lowest.

1 Like

That is a huge help, thank you. Our study will be primarily ED patients but I imagine that same approach will work and be appropriately conservative.
Was there a specific study you published on this I can cite or was it a component of your many publications with Bill Knaus?

There were many studies, and we created another index called the SUPPORT physiology score in this paper where you can see the spline equation in Appendix 2. I also have R code for it somewhere as well as for APACHE 3.

Thank you @f2harrell.
I am now anticipating a new problem with drawing conclusions about our objectives from this illness severity measure and the ordinal model - I would value your (or others) input.
As the pandemic progresses, the rate of patients coming to emergency is down. The problem with this is the ordinal model would see a decrease in the number of low severity patients as an equivalent change as an increase in the number of high severity patients. i.e. the model may see an increase in illness severity during the pandemic due to more low severity patients avoiding the ER and/or more high severity patients coming to the ER.
To demonstrate any change is in fact due to more severe patients coming to the ER I had already proposed several secondary analyses - looking at the rate of deaths and rate of admissions. However to specifically look at rate of higher severity, the only approach i’ve come up with is to use a binomial model (high severity visits | ER visits), but this would require dichotomizing the illness severity measure at some (arbitrary) point…
Any other suggestions?

Great question. I hope that a population epidemiologist will see this and respond.

Thank you for acknowledging my work, @DanLane911. On a topic like this, I feel compelled to defer to Frank Harrell and others with more experience in this domain.