Experts !
How accurate is this interpretation of Ordinal Logistic Regression Model intercepts (i am open to “completely inaccurate”) ?
assume you have an ordinal outcome a, b, c and d
in the logistic regression model output you get 3 intercepts
a | b
b | c
c | d
I tried to manually change the intercepts in my model to study the impact (in a very primitive way, i know). I noticed the following:
As the value of the level intercept increases (relative to model coefficients), it becomes HARDER for the model to “reach” the next level. setting the intercepts at higher values will even prevent the model to reach the next level.
Vice versa, the smaller the value, the easier for the model to reach the next level.
My understanding is …
If you increase the intercept value for a particular level, it means you are increasing the log-odds of being in or below that category. Consequently, it becomes harder for the model to “reach” the next level because the baseline probabilities for the higher categories have decreased.
Conversely, if you decrease the intercept value for a particular level, you are decreasing the log-odds of being in or below that category. This makes it easier for the model to reach the next level since the baseline probabilities for the higher categories have increased.
For your purposes it may be best to consider the no-covariate case, for which the intercepts are just a restatement of the cumulative distribution function. For the prorportional odds ordinal logistic models the intercept estimates are the logits of the empirical cumulative distribution function at all distinct values of Y except for the highest. This is for the model form \Pr(Y \leq y) = \text{expit}(-\alpha_{y}) where \alpha is the vector of intercepts, and \text{expit}(x) = \frac{1}{1 + \exp(-x)}. Then \alpha_{y} = \text{logit}(p) where p is the cumulative proportion Y \leq y. The intercepts move around as needed by the cell proportions.
Thanks a lot for your time and consideration. I am writing to discuss a recent challenge I encountered while working on an ordinal logistic regression model for predicting disease activity based on specific
criteria. The purpose of this model was to assist physicians in estimating the risk of patients in the clinic and determining the appropriate therapy based on their risk/activity level (from 1-4).
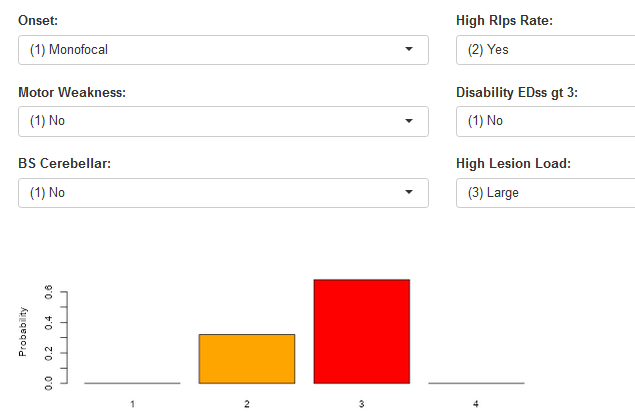
To simplify the process for physicians, I developed a user-friendly Shiny app (check attached screenshot) that can be accessed through a web page. The app allows physicians to select various criteria from drop-down lists and provides them with the corresponding probability of disease activity.
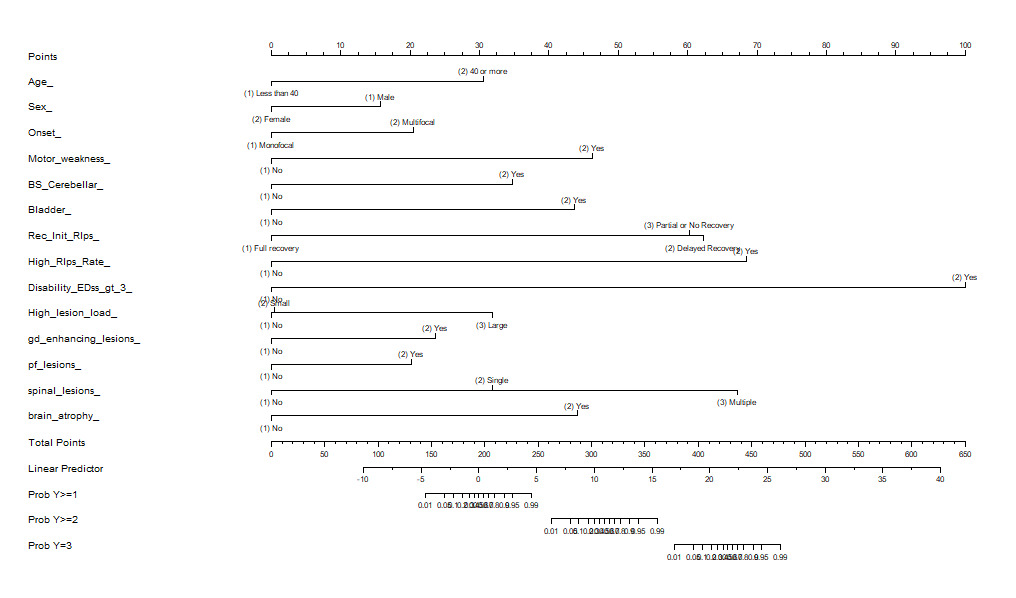
However, I have now been presented with a challenging request from physicians who wish to have a paper-based scoring system, or a score sheet, to evaluate patients easily. Unfortunately, the equation used in the model is too complex to be straightforwardly translated into a simple paper sheet. The nomogram function i found only addresses binary logistic regression model.
Given this situation, I wanted to seek your guidance on whether there is a way to utilize the coefficients and intercepts from the ordinal logistic regression model to create such a score sheet. If there is a feasible approach, I would greatly appreciate your guidance.
Additionally, I had a rather unconventional idea, which I suspect may be flawed. It involves converting the probabilities obtained from the model into a linear score and then employing linear regression. This
way, the equation for the score sheet would be much simpler. However, I am aware that this approach may oversimplify the underlying complexities of the model, and I would appreciate your expertise in
assessing its validity. Thanks again for your time and consideration. I eagerly await your insights and recommendations on how to proceed.
The rms nomogram function has a print method that will output the scoring tables you need, but the plot method does handle ordinal models too. You will use fun=list(...) to add axes for a variety of functions that evaluate the probabilities at different intercepts, and funlabel can label these axes. There is an example near the bottom of the help file displayed with ?nomogram but you will find it’s more elegant to adapt that example using the ExProb function to create the probabilities you need without having to deal with details about intercepts, as shown here.
@f2harrell
Your invaluable assistance once again proved pivotal in resolving the matter at hand. I have printed the nomogram. I am now able to provide an explanation to the physician on the process of summing up the points and determining their corresponding placement within the probability scores outlined below. However, I am slightly confused regarding the utilization of the “Linear Predictor” in this context.