Dear all,
I’m working on a subgroup analysis of an RCT for rapid identification of an important clinical feature. Sorry for being vague, but it’s sensitive (the main RCT has not yet been published). Essentially, there are two outcomes: The device states the patient has clinical state A (the severe phenotype), or clinical state B (the mild one).
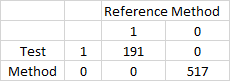
        0   1
   0  517   0
   1    0 191
AS you can, see, the test is very good. 100% sensitive, and 100% specific.
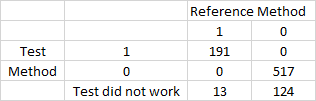
Now, I know, from clinical experience, that the machine doesn’t always work, and that our baseline prevelance of the severe phenotype is around 24%. If we look at situations where the machine doesn’t work, we get this table: (where 0 is, test didn’t work, 1, is test did work and is negative, 2 is test did work and is positive).
       0   1   2
   0 124 517   0

   1  13   0 191
Clearly, you can see that the post-test probability of the severe phenotype has reduced from ~24% pre test, to ~10% post-test, with a null result.
So, how do I report this? Clearly, I can generate a LR (in this case, a negative LR of just over 2), which might help clinicians, but I can’t see that generating a sensitivity or specificity table is of value here (we are only going to be interested when the test doens’t perform, who cares what the sens/spec of instrument failure is).
And if I am to generate a negative LR, how do i generate CI? By bootstrapping?
Interested in peoples thoughts on how to present this in a scientific and meaningful way.
Clearly, we have other predictors and subgroups within this dataset (it is a n ~ 2,500, multi-centre RCT), and there is significant variation in phenotype across them (i.e. the ICU has a very different level to the ED), although it does appear that the negative LR holds across all settings.
Thanks in advance - interested clinician, bad statistician!