I’m planning to perform a retrospective analysis to determine whether steroid doses improve outcomes for a subset of NICU patients. The outcome variable will be respiratory interventions at NICU discharge, where outcomes are ordered from best to worst (e.g. Room air > 1 L Nasal Cannula > 2 L Nasal Cannula > … > Ventilator > Patient Died). Patients received 0-6 doses of steroids.
I would expect that having one dose would improve outcomes, but subsequent doses would be less effective, so I was considering including a linear spine for dose number. However, I’m not sure how to interpret the Beta coefficients when there is a linear spline term.
Here are some simulated data without covariates.
require(rms)
set.seed(817)
N <- 350
# Patients have 30% probabily of getting any steroid
any_steroid <- sample(0:1, N, replace = T, prob = c(0.3, 0.7))
# Most patients get low number of doses
doses <- ifelse(any_steroid == 0, 0, as.integer(rgamma(N, 2, 1)))
# Cap doses at 6
doses <- ifelse(doses > 6, 6, doses)
# Making outcome numeric for simplicity
outcome.seed <-  as.integer(runif(N, 6, 20))
# One dose reduces outcome (makes it better). Subsequent doses are ineffective
outcome <- as.integer(outcome.seed - ifelse(doses > 0, 5, 0))

d <- data.frame(doses = doses,  outcome = outcome)
dd <- datadist(d); options(datadist = 'dd')

# Ordinal regression with linear spline
f <- orm(data = d, outcome ~ lsp(doses, 1))
ggplot(Predict(f, fun = plogis))
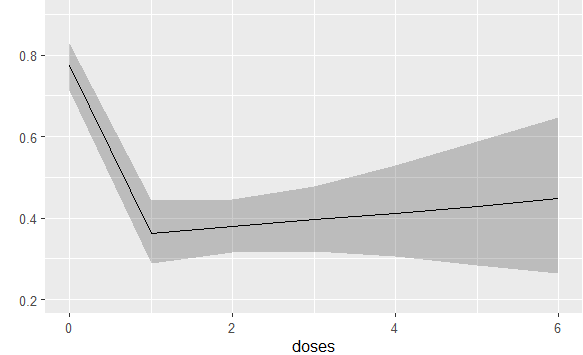
The prediction plot shows up exactly as I would expect, with one dose lowering the probability of a bad outcome and subsequent doses having essentially no effect. Here is the model output.
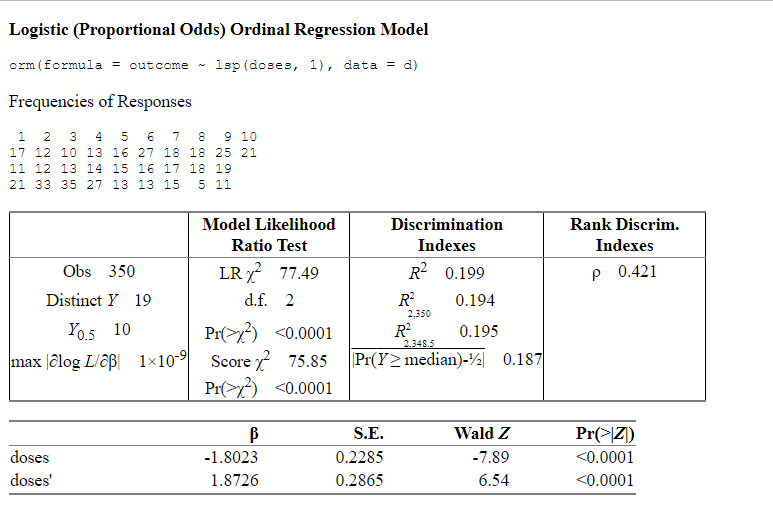
Based on the betas, I would say that one doses reduces the odds of a worse outcome by 1/exp(-1.8023) = 6.06 times. Subsequent doses increase the odds of a worse output by exp(-1.8023+1.8726) = 1.07 per dose. Does this interpretation make sense? Is there a way to get a p value or confidence intervals for the effect of more than one dose?