The CONSORT statement does not recommend the presentation of separate CIs for the outcome in each treatment group, although a new draft FDA guidance document is endorsing this practice (see examples below from [https://downloads.regulations.gov/FDA-2022-N-1961-0002/attachment_1.pdf]:
Page 82: CIs are presented for Lab data over time within each treatment group
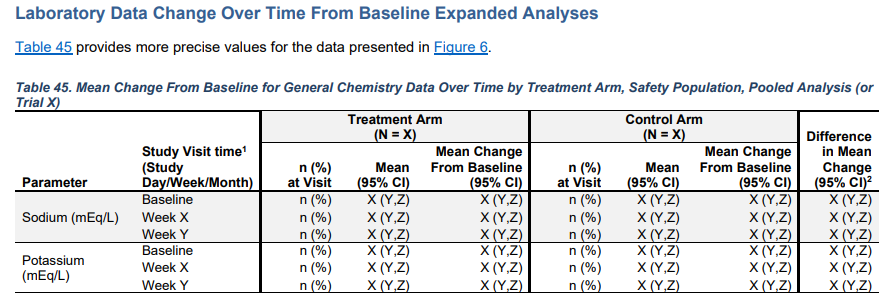
The table clearly violates statistical principles in big ways. Change from baseline is a terrible concept and confidence intervals for a single treatment group have no inferential interpretation unless the sample of persons in the clinical trial is a random sample from the population (it never is). We have to work hard to stop this practice. The worst examples even fail to include the relevant confidence bands (for treatment differences).
For interpreting the study itself, it’s not really useful. The one thing going for doing so is that it’s doing the same as providing standard errors (and even works on scales where sampling error is not approximately symmetrical such as rates, probabilities etc.), which are really useful for meta analysis (esp. when you do it arm-based, which conveniently deals with studies with more than 2 arms). I wish more authors provided everything needed for meta analyses…
Thank you, Professor Harrell. Is there a reference that further discusses why computing the CIs on a per-treatment basis has no inferential interpretation due to the way patients are sampled for RCTs?
If LSM, SE, and CIs for the outcome in each treatment group are not the appropriate statistics, are the following the appropriate statistics to report on?
The between-treatment differences (or odds ratios etc. for non-continuous outcomes) and their CIs (i.e., only report on the inferential statistics for the effect size)
Observed mean and SD within each treatment group (i.e., descriptive statistics instead of inferential statistics within each treatment group)
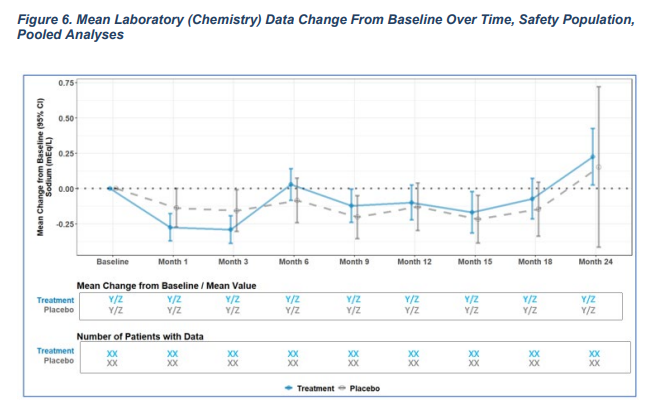
For example, if one wanted to present the data within each treatment group over time, would simply plotting the observed mean and SD over time by treatment group suffice? Below appears to be a bad example from the FDA showing the LSM and CIs on a per-treatment basis, and using Change From Baseline as the outcome.
the above table is not uncommon unfortunately, I was looking at such a table just this moment. In Senn’s book he makes the point early on, as follows (section 3.3 Defining effects):
The effect of a treatment is not, for example, the difference between the patient’s state after treatment (outcome) and his state before treatment (baseline) although this might under certain circumstances be the way in which we should choose to measure an effect. Actually, in general, this method of comparison with baseline is very poor. For example, we might have a number of patients present with multiple sclerosis. After 10 years’ treatment with a new drug, there is no difference between the current functional state of any of these patients and their state at presentation. If we make the mistake of defining the effect as being the difference between outcome and baseline, then for each of these patients it would follow that there has been zero effect. Of course, since we know patients with multiple sclerosis usually have a progressive worsening, the fact that these did not is a good indication that the drug is effecitive. In fact, in this case we should be very far from believing that the effect was zero.
(i have transcribed it from the text so there may be some errors) People will want to see the kind of plot you show, but emphasis should be given to the difference between groups (however it was prespecified) and annotated onto the figure
edit: regarding the ‘value’ of putting CIs on individual estimates: “It does not matter which field you look at but scientists do not use representative material when constructing experiments. This is so well understood when physics and chemistry are considered that it is not even discussed. But, when human biology is concerned, commentators frequently assume that representativeness would not only be desirable but essential.”