Following an in-depth conversation with a colleague, I thought it would be interesting to hear your opinions on a paper that generated considerable debate in the cardiovascular community. I’m not an MRI doc, so my particular focus was on the biomarker assessment of patients enlisted in the study that sought to compare different imaging characteristics in the assessment of individuals recovered from COVID-19: Puntmann et al, Outcomes of Cardiovascular Magnetic Resonance Imaging
in Patients Recently Recovered From Coronavirus Disease 2019 (COVID-19) - Outcomes of Cardiovascular Magnetic Resonance Imaging in Patients Recently Recovered From COVID-19
The authors found that cardiac MRI (CMR) revealed cardiac involvement in 78% of patients and ongoing inflammation in 60%, independent of pre-existing conditions, severity and overall course of acute illness. From an imaging point of view, it is interesting to learn that the differences described between patients, healthy controls and risk factor-matched controls (in T1 and T2 mapping) are overall small; but also, they were measured in the mid septum, which is apparently the area least likely to be affected by myocarditis.
Now, onto the biomarker aspects:
A greater proportion of COVID patients had quantifiable (but ‘normal’ as in <99th centile) hs-cTnT concentrations - see table 1. Only 22% of healthy individuals had quantifiable concentrations. But from first principles: The definition of a high-sensitivity Troponin assay includes that more than 50% of healthy individuals have to have a quantifiable cTn concentration with the assay. hs-cTnT achieves that just about - I think the assay quantifies about 55-60% of healthy individuals (and it follows that 40-45% have a hs-cTnT concentration <3 ng/L). So by chance a small percentage?
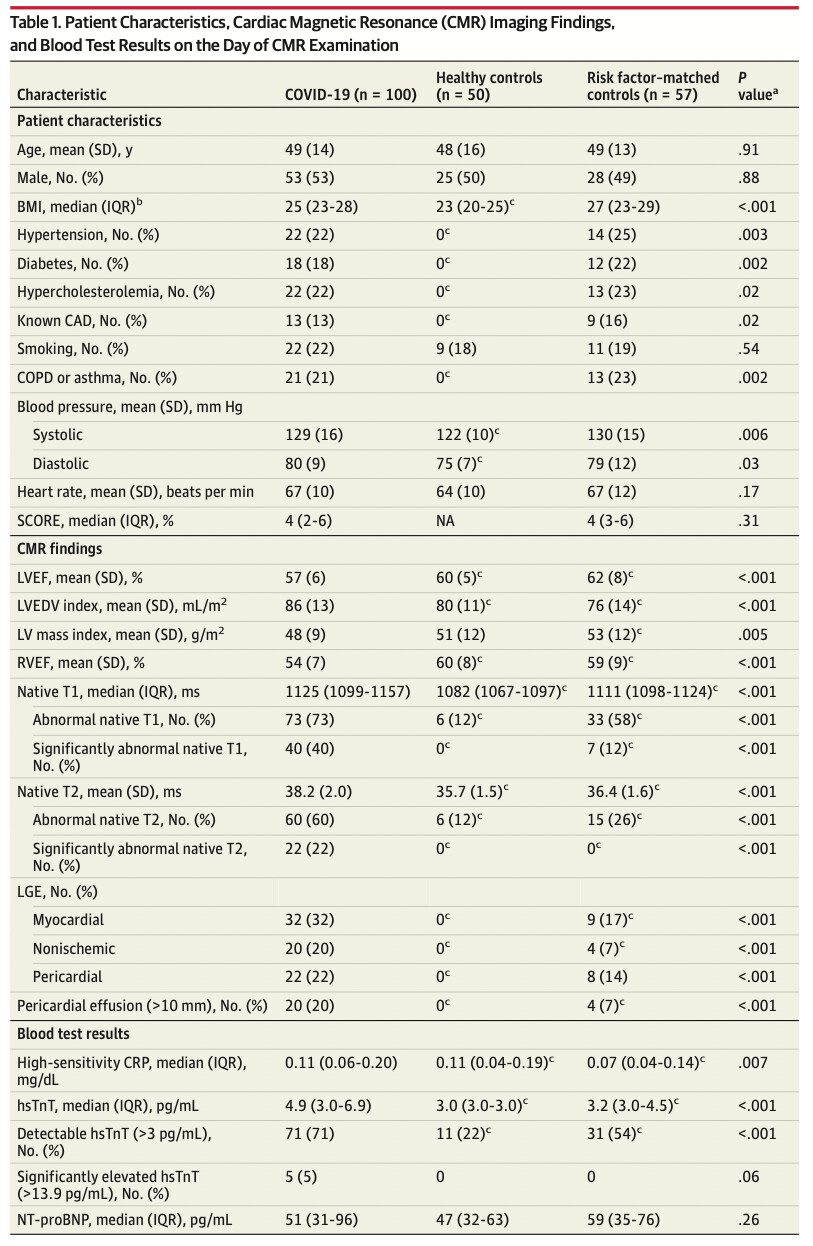
The next ‘issue’ is that neither the healthy control nor the risk factor-matched control group are necessarily representative of a ‘normal population’, or the populations are indeed too small to be certain: after all, you would expect at least 1 of 100 healthy individuals to have a hs-cTnT above the 99th centile (14 ng/L) - they have 0! This might have been due to chance, given they have 50 and 57 patients in either group, respectively. The possible explanations here are that 1) the groups were too small or b) the inclusion criteria too strict.
This then leads me to another gem, when looking at group sizes:
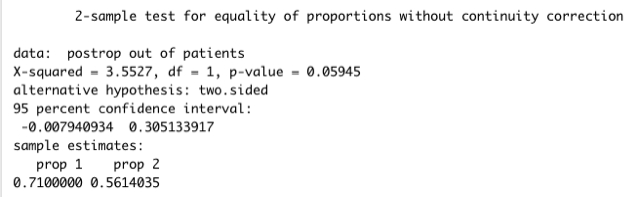
The analysis suggests that a greater proportion of patients had a detectable hs-cTnT concentration (71% (n=71) vs 22% and 54% (n=31) when comparing to healthy & risk factor-matched controls), p <.001. The p-value I assume comes from an ANOVA here, but what we are really interested in is whether the difference between COVID patients and risk-factor matched individuals is different. Here the authors state in table 1, footnote c that the ‘post hoc test for the difference’ is p<.05. That’s true if you compare the proportions from a chi-square table (without Yates’ continuity correction to adjust for a small sample - I think fair) - p = 0.036. What happens if your risk-factor matched control group had, say, 32 patients (instead of 31) with a detectable hs-cTnT level? I’ve quickly simulated this in R - in short, your p-value then is >0.05.
Importantly, I’m not here to argue the data is incorrect. But I think it bears some relevance to appreciate how finely cut those group sizes and observed differences truly are. What does everybody else think? Have I made a crucial error in my interpretation of the data?