I have done a logistic regression, looking at 8 variables (severity of anemia, male, age etc), and assessing their association with the presence of morbidity at 5th postoperative day. This is a scientific model motivated by a descriptive purpose.
A reviewer commented, “The multivariable models have continuous independent variables. The authors are asked to add how linearity between logit and the continuous independent variables was addressed”. [Question] Is it necessary to check this given my intention is to build a descriptive model?
Nevertheless, I have done the following:
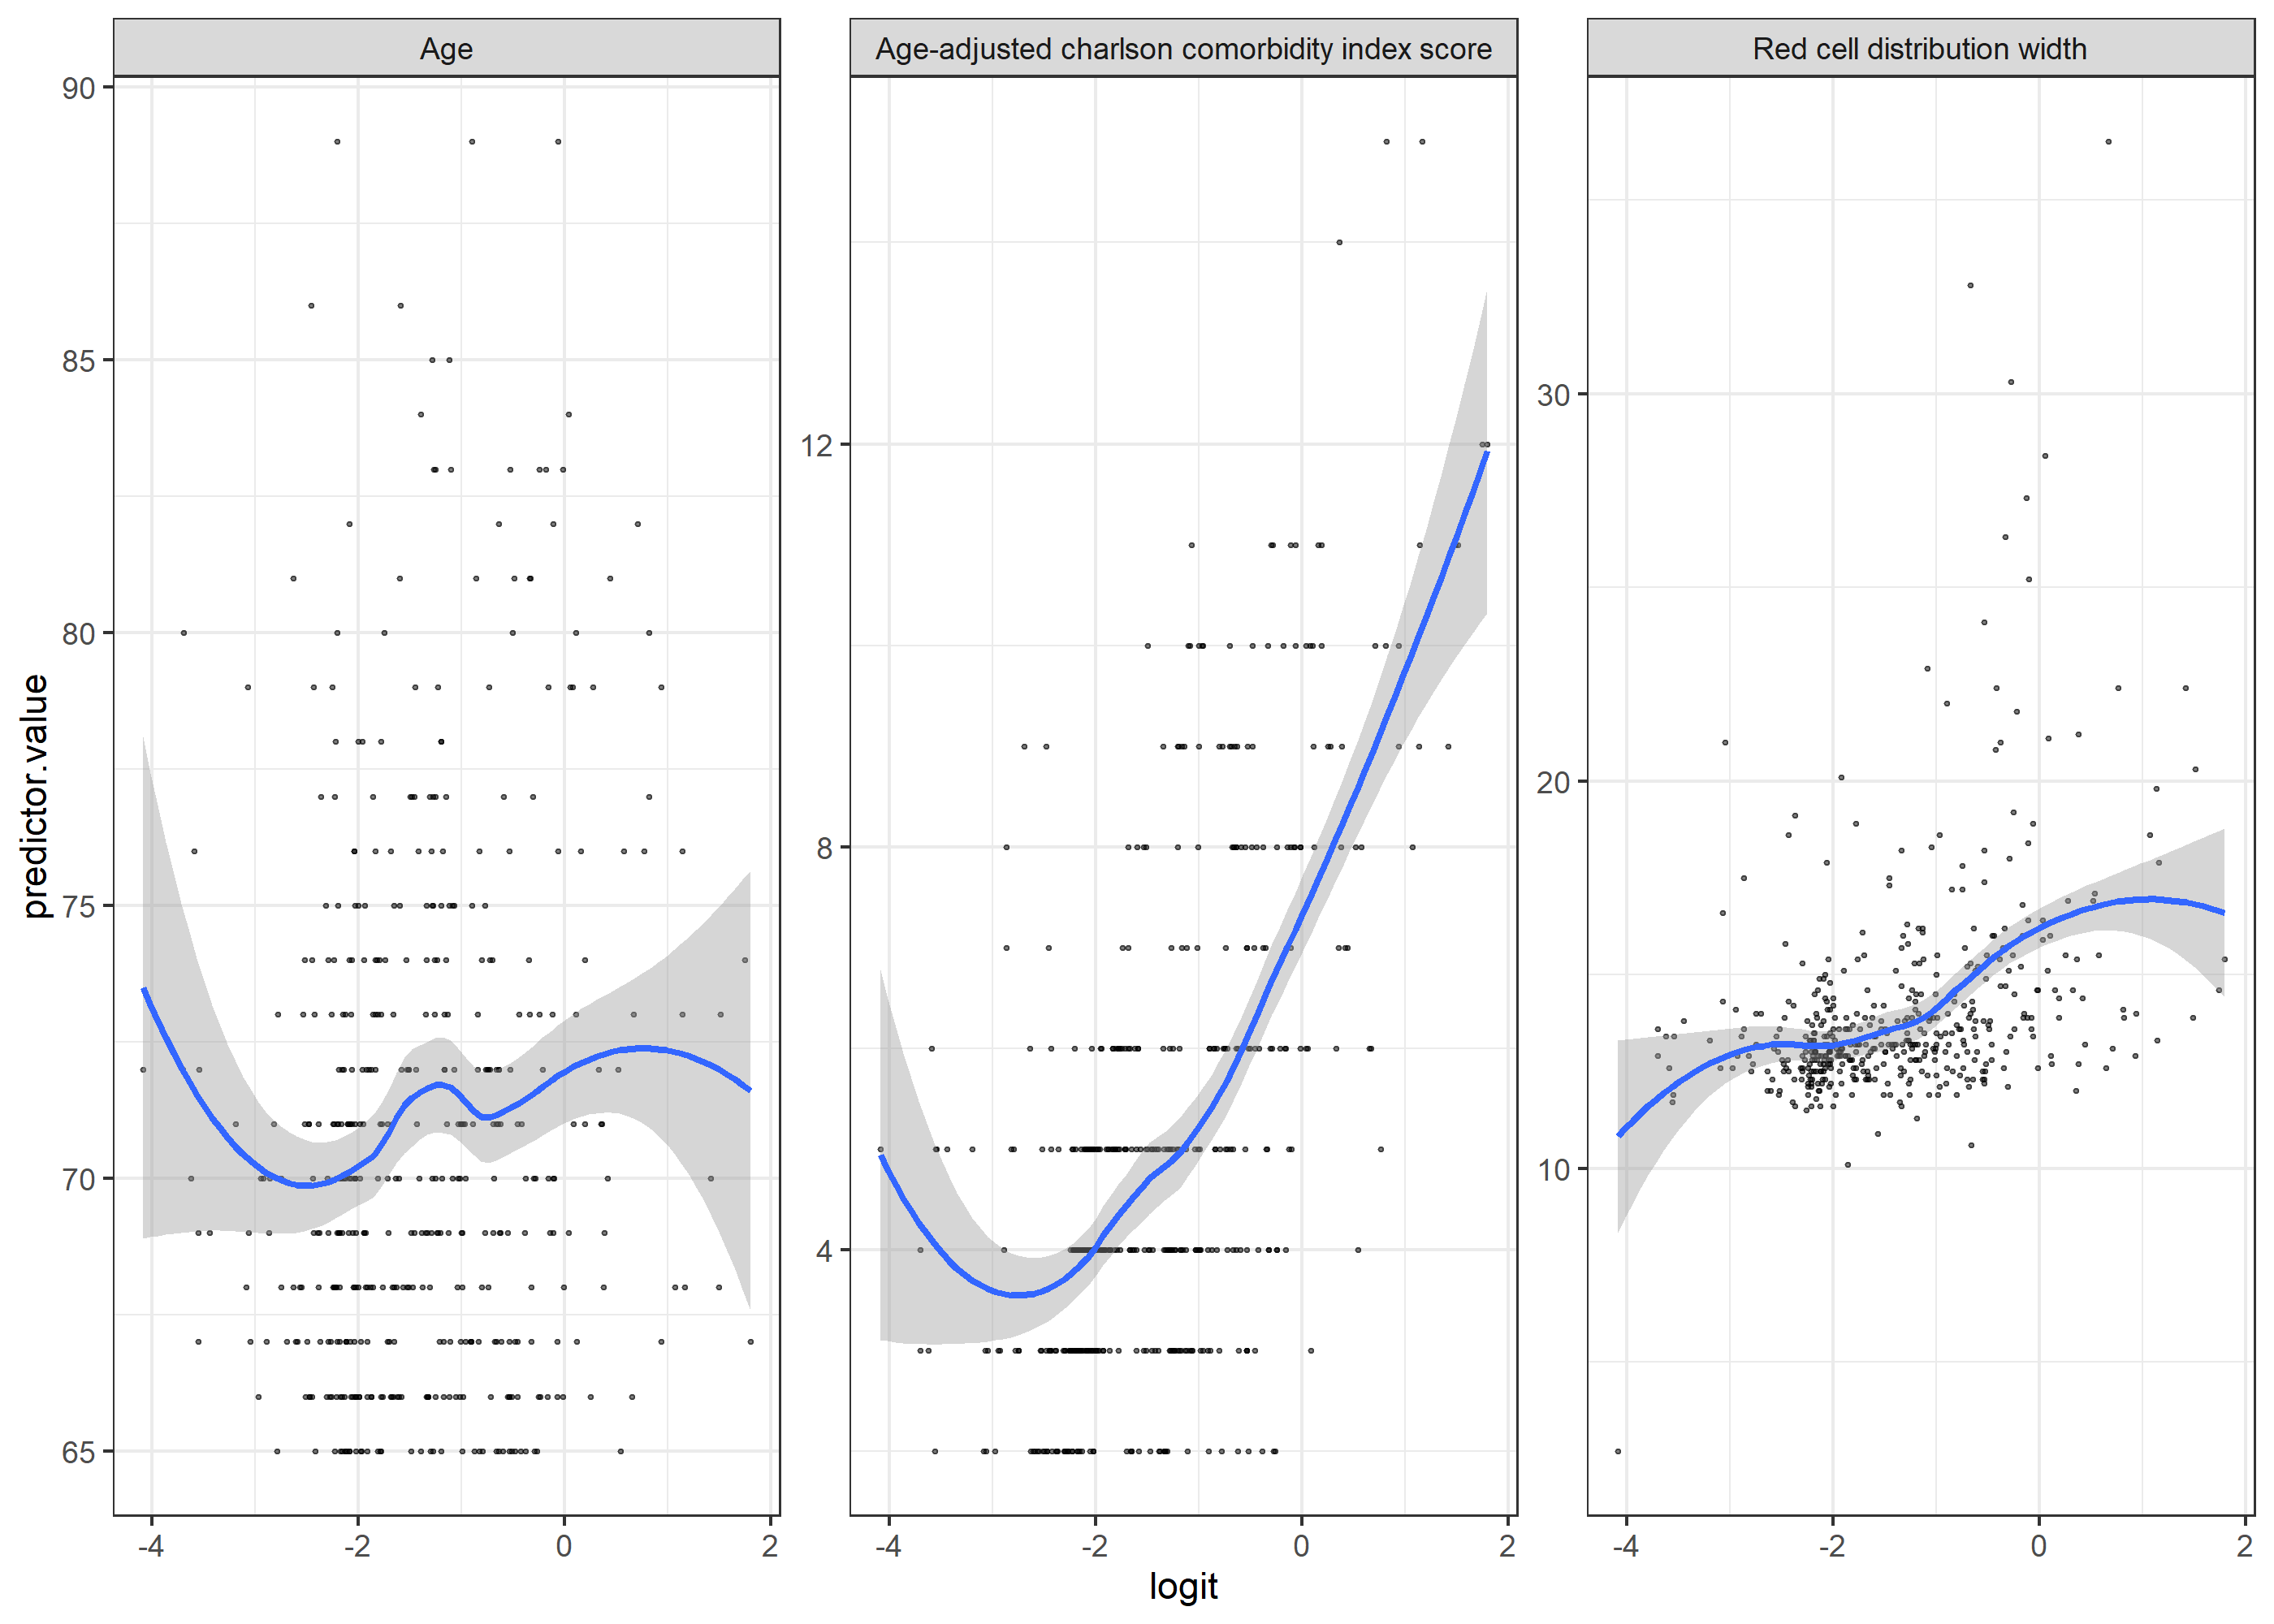
1. Visual check by plotting the continuous variables with the logit of the outcome
- All 3 continuous variables seem to violate the linearity assumption
(using loess function as smoother)
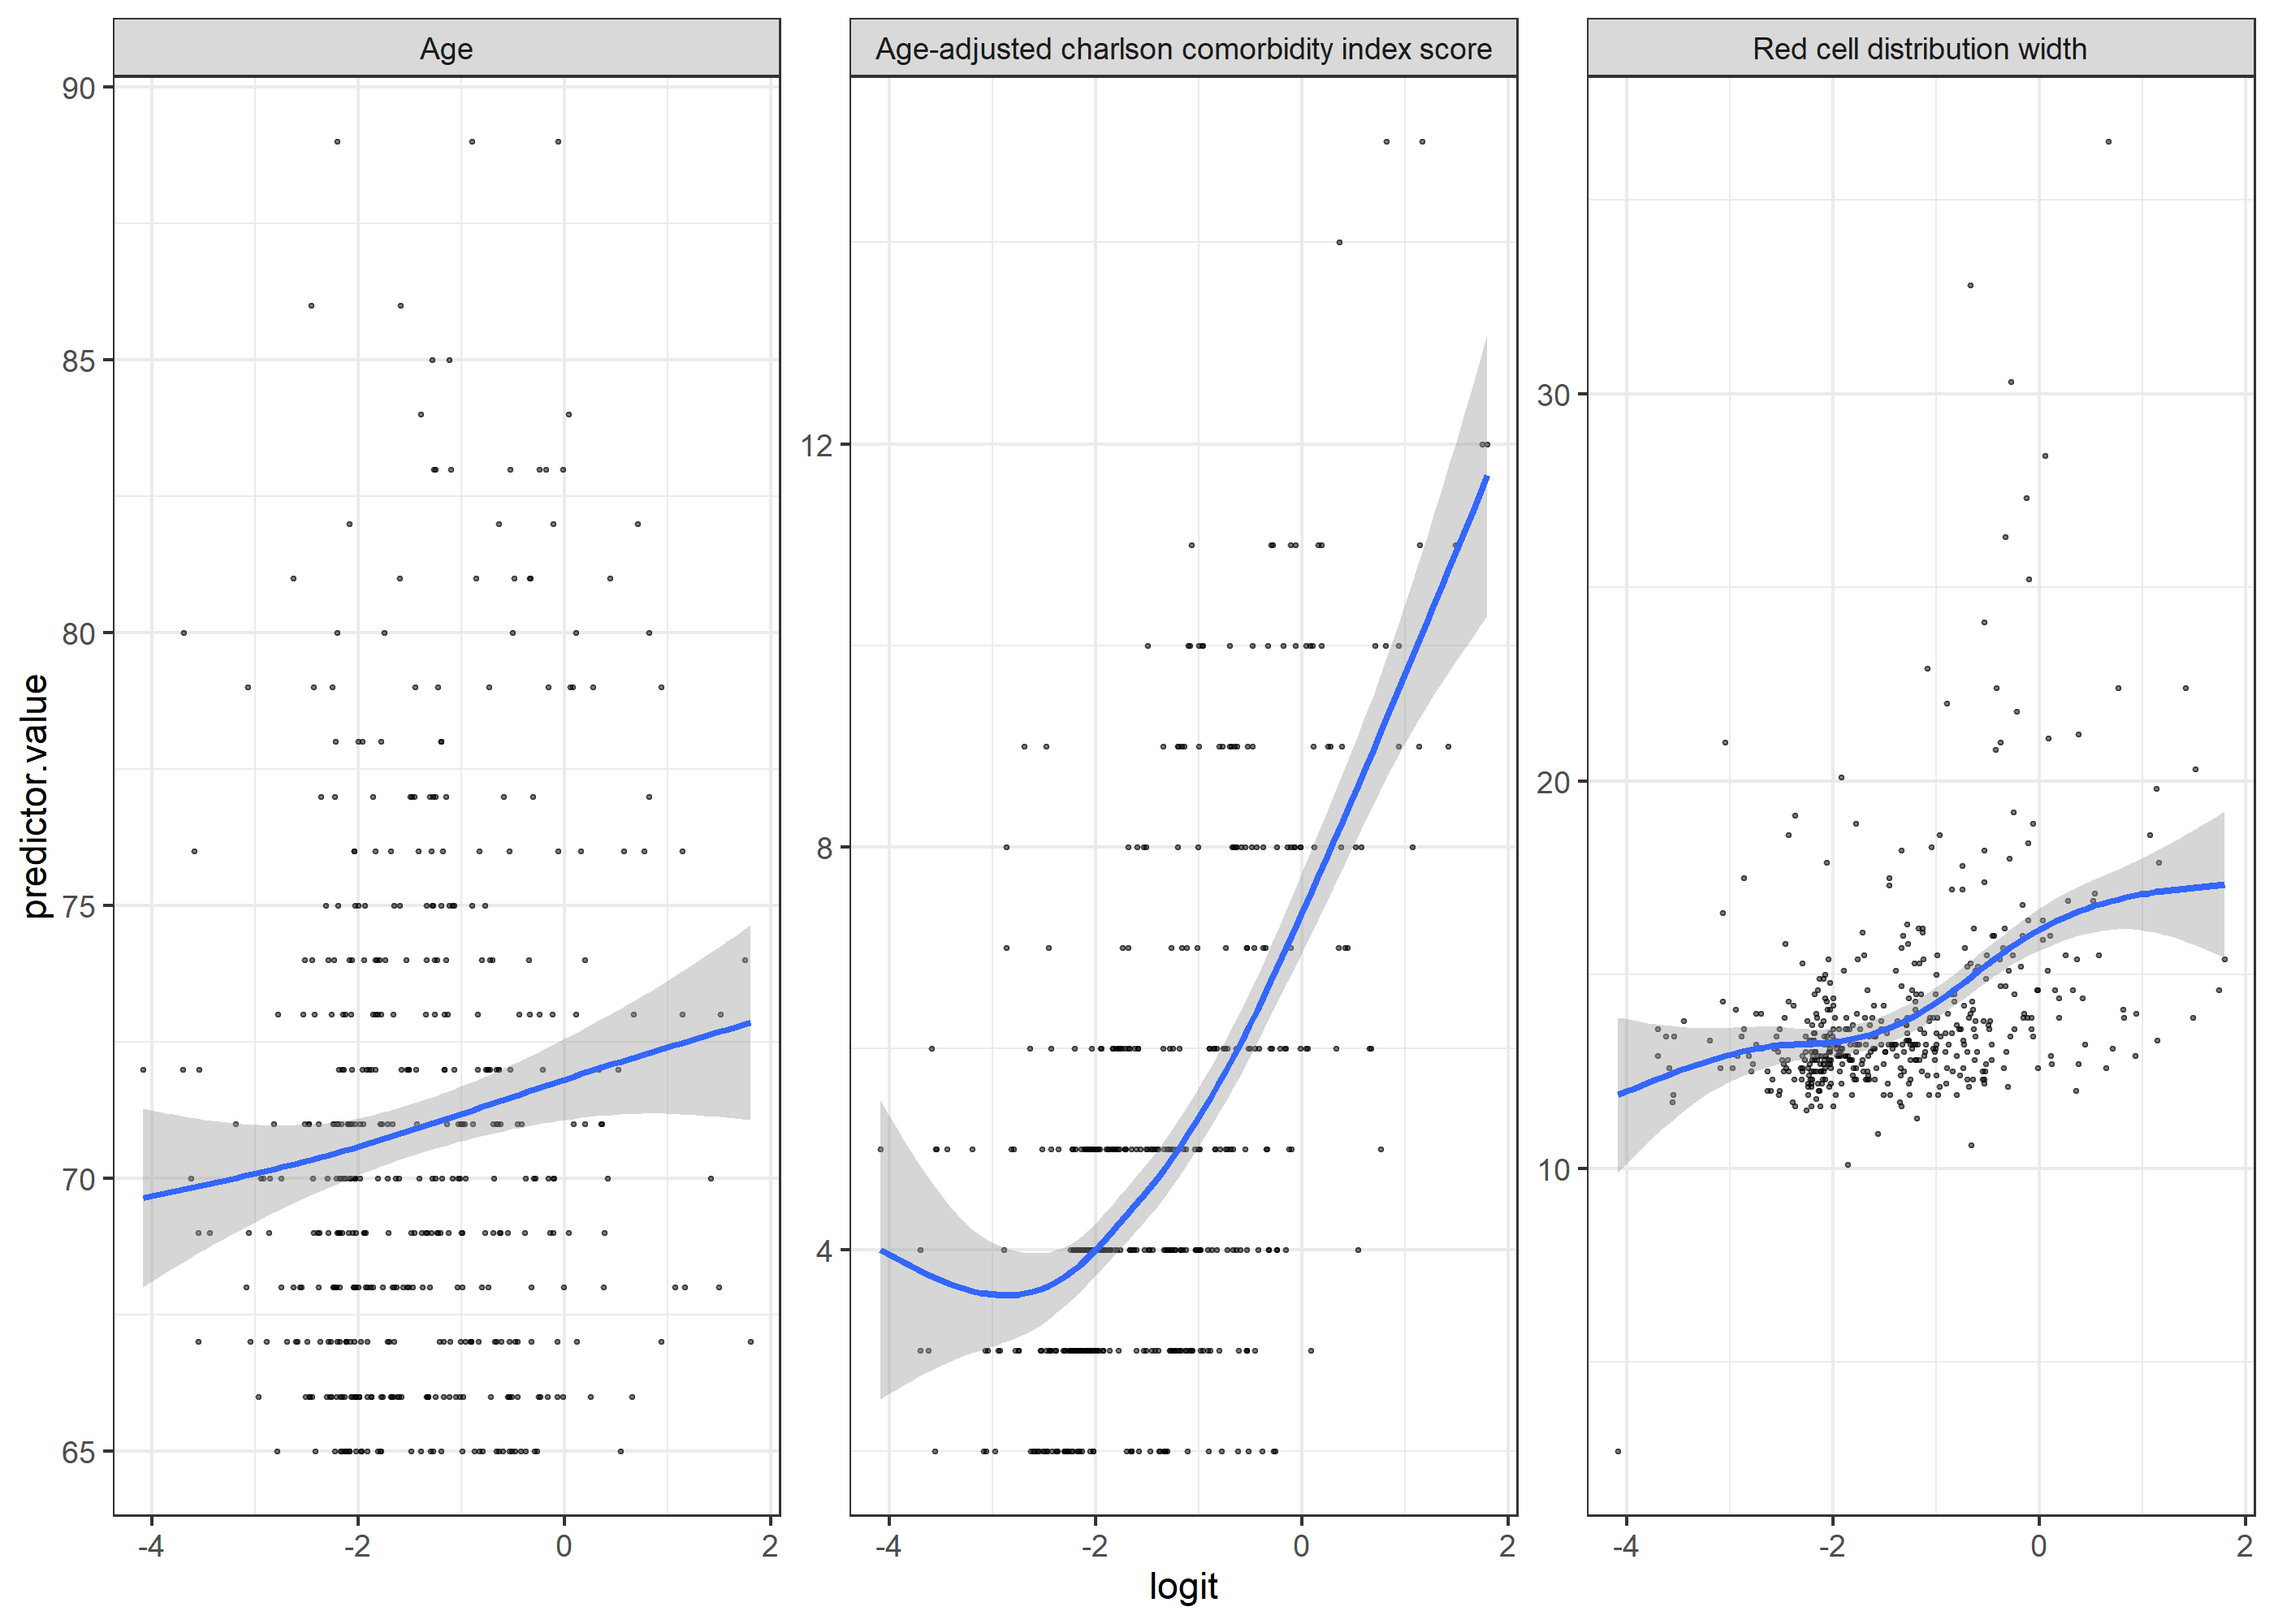
(using gam function as smoother)
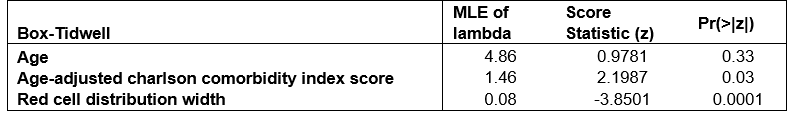
2. Box-Tidwell test for linearity
- Only 2 continuous variables seem to violate the linearity assumption
[Question]
- How can I address this? Can I use the generalized additive model?
- Is transformations (e.g. boxcox) of the continuous variables recommended?
Thanks!
Edit: added the plot with gam function as the smoother
Related issues are discussed at RMS General Regression - modeling strategy - Datamethods Discussion Forum
First a side issue. Use of the Charlson comorbidity index is highly discouraged. It is not competitive with later indexes (has low predictive discrimination / ability to adjust for confounding) and it has a math error in its construction.
The overall philosophy you have adopted for this analysis has problems in my opinion. First of all, nonlinearity is a real problem whether doing descriptive or formal analysis. But mainly you are essentially hoping for linearity then getting surprised by goodness of fit assessments that provide evidence for nonlinearity. As covered in chapter 2 of RMS pre-specify a model that allows all continuous variables to be fitted nonlinearly if you do not have evidence from previous data for a linear relationship. Linearity is just not that common. Use a regression spline such as a restricted cubic spline to make this easy.
Without prior knowledge you can specify the number of knots in the splines based on the effective sample size you have. If you have a large number of events and of non-events you can allow them to have 5 knots, giving each predictor 4 parameters in a restricted cubic spline.
Morbidity is an ordinal variable so make sure you don’t analyze it as binary.
From the spline function you can test for linearity but this test is not actionable and just serves to convince others that there is statistical evidence for complexity.
Some example code using the R rms package analyzing a dataset called d:
require(rms)
dd <- datadist(d); options(datadist='dd')
f <- lrm(morbidity ~ x1 + x2 + x3, data=d, x=TRUE, y=TRUE)  # morbidity is binary (regular logistic) or ordinal (PO model)
f
ggplot(Predict(f))  # show partial effect plots like you have above
ggplot(Predict(f, fun=plogis)) # same but on probability scale
anova(f, test='LR')   # anova table including tests of linearity
nomogram(f)
2 Likes