I think one of the hindrances to improving analysis in papers / statistical practice is the lack of canonical examples of real experimental data with associated commentary about why certain methods were / were not used.
My work is on applying AI within clinical practice - so though I would see if the datamethods.org community could give me some advice
A common use for AI within medical imaging is to replace the part of reporting that involves experts making laborious manual measurements (e.g. size of a tumor, volume of organ) from images (X-rays / CT / MRI / Ultrasound). When you observe what experts do you quickly realize that there is a fair bit of variability in their clinical practice (either they are measuring to subtly different boundaries, the boundaries are indistinct, where they should measure is poorly defined in guidelines).
Consequently, for most validation AI vs expert measurement studies you end up with multiple expert reads on each image vs 1 AI measurement.
Despite this common experimental set-up for medical AI:
There is remarkably little consistency in how papers report the performance of their model against multiple experts.
There seem to be hundreds of different published methods extending Bland-Altman - but no advice on which to use.
I think you want three measures:
A measure of the difference between AI and the expert consensus.
A measure of the difference between the experts to help contextualize (1)
A comparison of (1) and (2) in the hope:
that (1) is definitely better than (2)
or be sure that (1) is at least no worse than (2) (within some margin).
What not to do
Correlation coefficient / ICC etc.
Arbitrarily picking a number as a threshold and working out sens/spec.
I have been working on a few AI validation projects in the diagnostic imaging space and have been running into the similar problems with varying levels of agreement among the “experts”.
I’ve been exploring some of the methods outlined in Zhou’s “Statistical Methods for Diagnostic Medicine” for the handling of imperfect gold standards (also see Dawid 1977 and Water 1988).
You can create a “latent class” under the assumption of conditional independence using the expectation maximization algorithm.
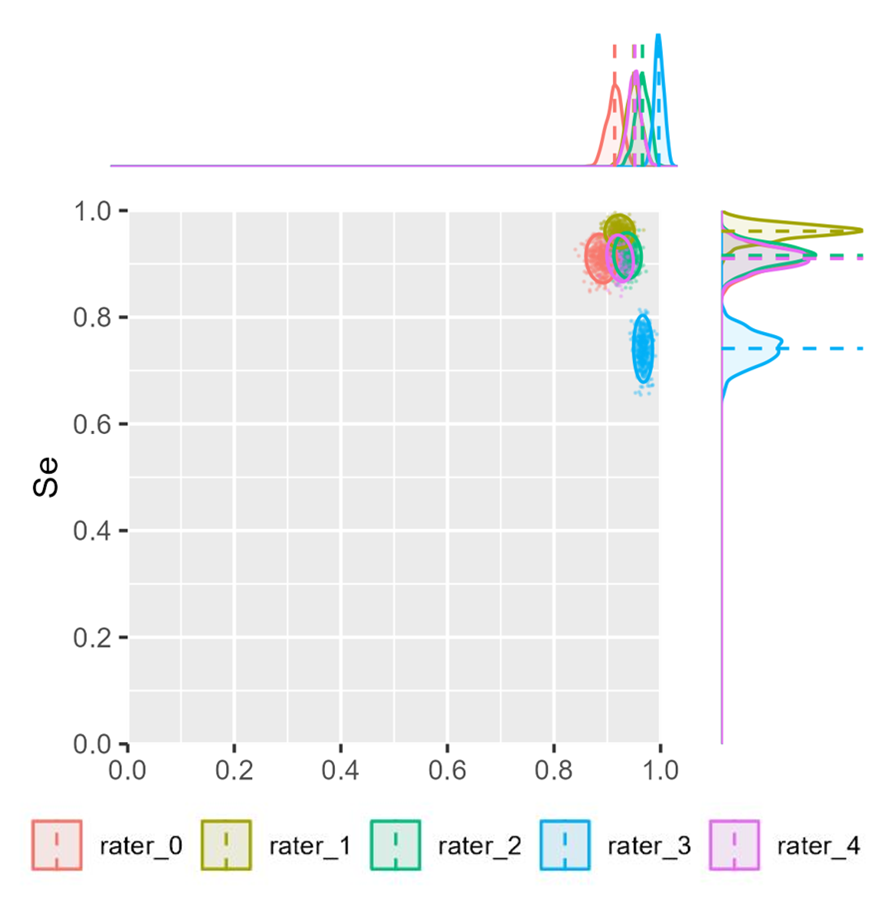
I’ve fiddled around with bootstrapping the EM estimates to see the overall spread of sensitivity and specificity for each of the raters. Here is an example:
Once upon a time I wrote and hosted an app https://eamonn5.shinyapps.io/methcomp/ to help me understand method comparison better (see the ‘No reps’ and ‘reps’ tab).
I found the methcomp R package useful in this regard, the approaches there can be extended to more than 2 measurement methods.
You may need to start with images that are 5-10 years old, when the true clinical outcome (cancer, death, pneumonia) has been established. Note that when you have experts review the cases (not the images), 5-10% will not have an established truth of clinical outcome. A fair number are fuzzy at best. Then take your ~90% with a true climical outcome - the gold standard truth, and then test the images against experts and AI. It is not infrequent for experts to disagree at the margins. But if you have ground truth in the clinical cases (not the images), you have a chance to detect this. Statistical methods, no matter how good, will never help you until solve the ground truth problem.
Peter
Perhaps my question is more about what estimands you would want for this experimental design (and how you can derive it from a model). 1) an error of the AI from the consensus of experts 2) error of a random expert. 3) the difference between the two + interval.
Thanks - the one difference is that if I use the suggestion from: 16.2 Comparison of Measurements with a Standard - what modification should I make when best standard is “defined” by the average of the human observers. This biases it against the AI.
Analyzing an average or a consensus will provide an upper bound on how good humans can be. Then the main analysis needs to include individual human assessments so that average absolute disagreements between AI and single human assessments can be estimated.