What method should I use to estimate a cutpoint of a quantitative variable X to determine 2 groups of patients regarding the response Y, a survival / time-to-event outcome?
The classic approach I’ve seen, is to plot the ROC curve and choose the cut-off closest to the perfect classification point. To use this, one has to transform the time-to-event data into a binary endpoint (e.g. survival at 3 years)
Maximally Selected Rank Statistics: I saw a function that does this in {survminer} package. It calculates the logrank statistics of all possible cutpoints and choose the maximum one.
And others like… quartetic method, median selection (doi: 10.1111/COA.13689). I have not seen these methods yet.
The general flavor of discourse around here tends to not recommend cutpoints/dichotomizing continuous predictors. See: Categorizing Continuous Variables
Do you have a particular aspect of your research that makes finding an optimal cutpoint necessary?
Agreed that dichotomization is not the best idea - however, I have had my arm twisted before so I did the following:
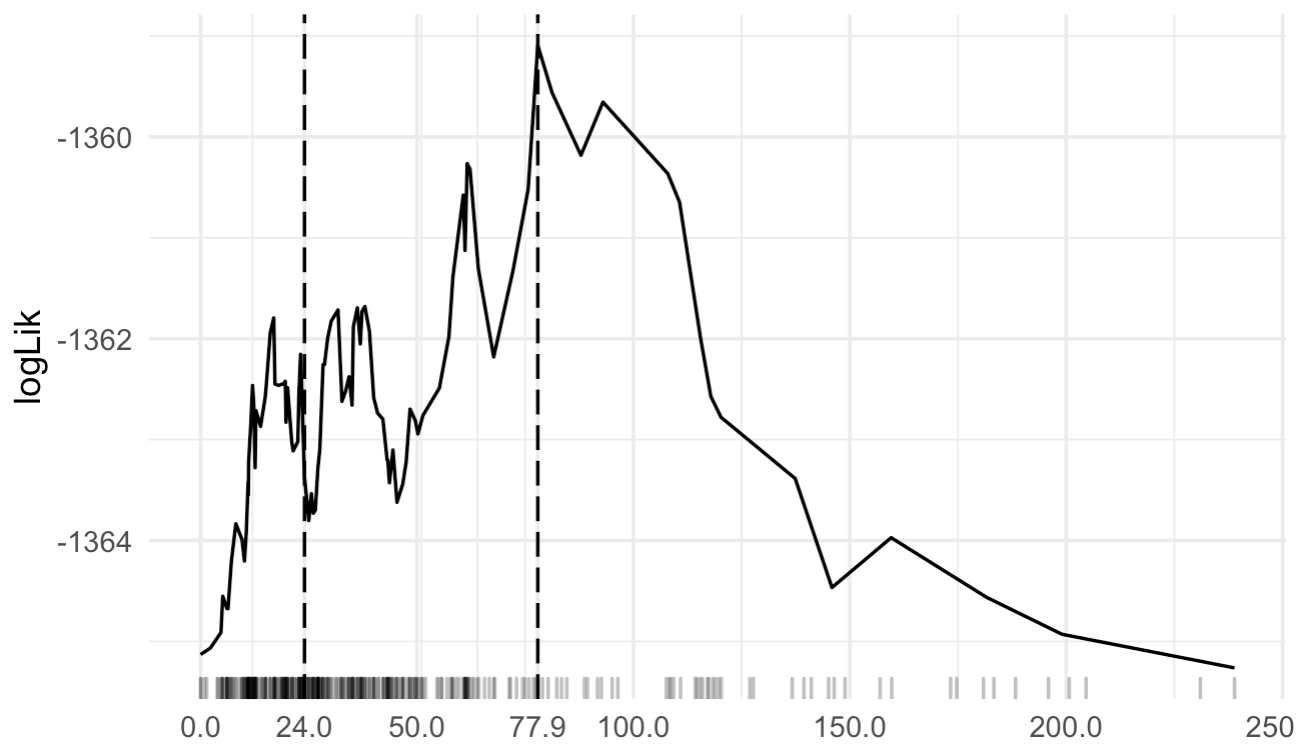
calculate some sort of statistic (like the log likelihood) from a cox model for various cutpoints for X and choose the highest log likelihood. For example this was a plot from an analysis I put together:
Or, use a tree based method with the one predictor. I found it harder to extract the optimal cutpoint from.
Whichever way you go I strongly recommend getting a measure of variability somehow (i.e. using bootstrapping). When I put this together and showed the huge CIs in the ‘optimal’ cutpoint I was able to dissuade folks from going down the route of dichotomization.