This is a Twitter thread that I have posted today, moved here for further discussion:
Credit to @Srpatelmd for spotting this:
This is a crossover RCT of 20 sleep apnea patients comparing one night of atomoxetine 80mg plus oxybutynin 5mg (ato-oxy) versus placebo administered prior to sleep
Primary outcome: apnea hypopnea index (AHI), continuous variable. Higher AHI = more severe sleep apnea.
In an effort to show that ato-oxy was especially effective in the patients with more severe sleep apnea, the authors included the following subgroup analysis:
“When analysis was limited to the 15 patients with OSA (AHI≥10 events/h) on placebo, ato-oxy reduced AHI by approximately 28 events/h or 74%”
Does anyone see the problem with this? Go ahead, take a guess.
Okay, here’s the problem: when you restrict analysis of a crossover trial to patients with worse results during the placebo period of the trial, you introduce a serious bias
Because AHI is variable from one night to the next, restricting analysis according to high AHI on one night of placebo results in a “subgroup” whose AHI is more likely to be lower on a different night (regression to the mean…)
This will bias the results in favor of Drug in the supposed “subgroup analysis”
Here, I’ll prove it for you.
IMPORTANT NOTE: the next several statements refer to simulated data, NOT the data in the actual paper which inspired this thread
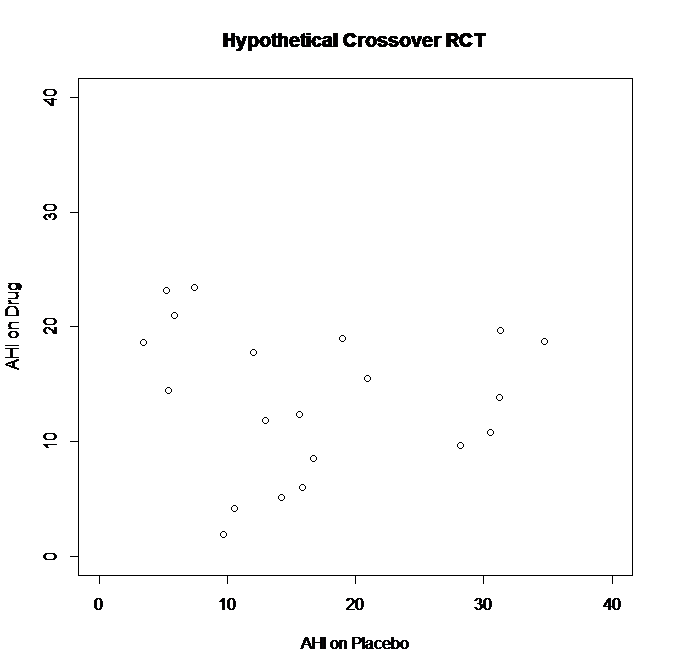
First, I’ll generate a random dataset: two sets (one “Placebo” and one “Drug”) of 20 observations with normal distribution, mean=13, SD=8 (truncated to values 0-40 to be in line with something like realistic AHI values & avoid negative numbers)
Some patients had higher AHI on Placebo than Drug (far right of graph – AHI’s in the 30’s on Placebo versus 10-20’s on Drug)
Some patients had higher AHI on Drug than Placebo (far left of graph – AHI’s in the 20’s on Drug versus <10 on Placebo)
Overall, there was no difference between the groups. Paired t-test for difference in AHI on Drug versus AHI on Placebo: p=0.32
CONCLUSION: “no significant difference” in AHI for Drug versus Placebo in this crossover trial.
BUT WAIT! What if we test the results in patients with “severe OSA” - defined by results on Placebo?
Now I’ll restrict the analysis to patients with AHI≥10 on “Placebo”
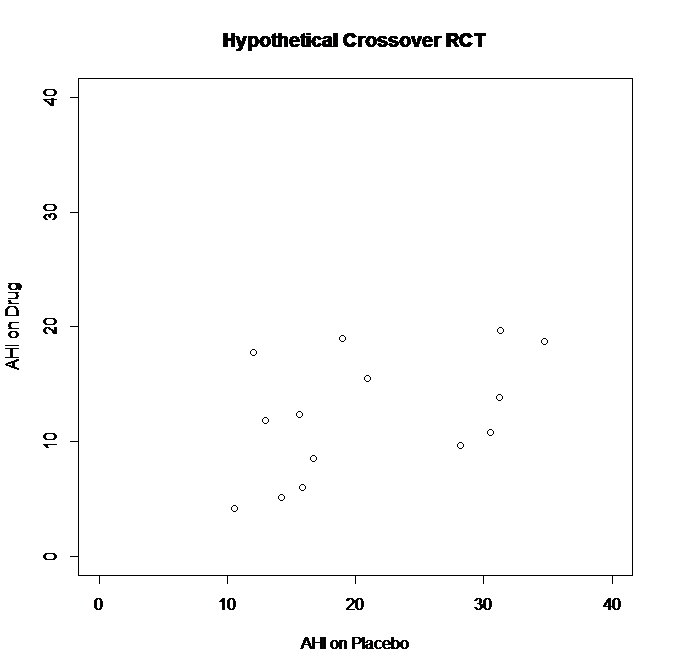
Here’s the simulated data once I remove the 6 patients with AHI<10 on Placebo, leaving 14 patients with AHI≥10 on Placebo
See what happens? By restricting the analysis to patients with AHI≥10 on Placebo, I’ve removed that cluster of points on the left side of the graph, where patients did “better” on Placebo (lower AHI) than they did on Drug.
Paired t-test for difference in AHI on Drug versus AHI on Placebo in subgroup analysis: p<0.01
Ah-ha! See, p<0.01 in this “subgroup analysis” - now I can write my paper and really emphasize that my drug works REALLY well as long as it’s used in patients with more severe OSA.
But that’s not reflective of what’s really happening here.
Restricting to only people with poor results on Placebo introduces bias because of regression to the mean.
It eliminates the people who happened to do “better” on Placebo than they did on Drug.
Okay, let’s step out of the vortex: the data shown in this exercise was simulated, not the real RCT data.
However, it exposes a serious flaw in using data from the placebo night in a crossover RCT to “restrict” analyses based on “disease severity”
“But Andrew, how can we test if the treatment had an effect in patients with more severe OSA?”
There was a better way to do this, and it would have been so simple, too.
Maybe the authors will consider it as an addendum / correction to the paper.
Instead of using AHI≥10 on placebo, doing a subgroup analysis of patients with AHI≥10 on the “screening” or “baseline” exam (instead of using the data from the placebo night) would have been closer to the stated objective.
However, by restricting the range according to their AHI on the placebo night - the authors introduced a bias that overestimates the treatment effect in this subgroup.
It’s a shame, I don’t know if the authors realized the mistake they were making, but several times in the paper they alluded to how the results were especially impressive when restricting to patients with AHI≥10 on placebo.
R code to generate the two figures above:
install.packages(‘truncnorm’)
library(truncnorm)
set.seed(7)
Placebo=rtruncnorm(n=20,a=0,b=40,mean=13,sd=8)
Drug=rtruncnorm(n=20,a=0,b=40,mean=13,sd=8)
DATASET=data.frame(cbind(Placebo,Drug))
DATASET
plot(x=DATASET$Placebo, y=DATASET$Drug, main=“Hypothetical Crossover RCT”,
xlab=“AHI on Placebo”,
ylab=“AHI on Drug”,
xlim=c(0,40),
ylim=c(0,40))
t.test(DATASET$Placebo,DATASET$Drug, paired=TRUE)
DATASET_2 <- DATASET[which(DATASET$Placebo > 10),]
DATASET_2
plot(x=DATASET_2$Placebo, y=DATASET_2$Drug, main=“Hypothetical Crossover RCT”,
xlab=“AHI on Placebo”,
ylab=“AHI on Drug”,
xlim=c(0,40),
ylim=c(0,40))
t.test(DATASET_2$Placebo,DATASET_2$Drug, paired=TRUE)

