I am looking at an RCT comparing insulin levels in subjects receiving an SGLT-2 inhibitor vs placebo. Insulin levels were taken over 20 weeks. A repeated measures ANCOVA was used which I know is not optimal for repeated measures analysis. It is my understanding that it is not appropriate when there are missing values. In this study the missing data for the treatment arm A is primarily due to elevated triglyceride levels which are not seen in the placebo arm B. Is each time point considered when the percentage of missing values is calculated or is it simply the number of individual subjects? Also is a mixed effects model the optimal method for analyzing repeated measures with missing data.
just to clarify please, when you say “missing data” you are referring to patients being lost to follow-up, right?
1 Like
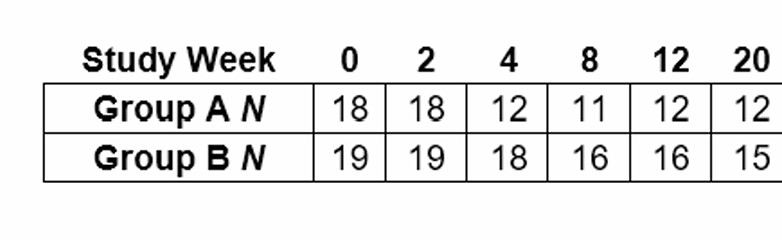
Thank you Ehud. So for group A the treaated group you start with 18 subjects and measure their insulin level at time 0, there are 18 measured at time 2 weeks, 12 at 4 weeks and 11 at 8 weeks. Therefore you have complete measurements for subjects at week 0 and week 2 but at week 4 you only have 12 with 6 dropped out and so on. I was wondering if you simply calculate 6/18 as the pct missing or 25/108 since there would have been 108 measurements over the 6 time periods. My understanding is that repeated measures ANOVA is biased with missing data.
first, just as a nomenclature thing, because insulin levels is your outcome/endpoint throughout a follow-up period, and the data is missing because you were unable to reach people to measure their insulin levels - i believe framing that as “missing data” is inaccurate (and it will lead to a less efficient google search). “missing data” is often when subjects may have some of their covariates values missing (but not all). what you have i believe is more commonly referred to as “loss to follow-up” (“right censoring”).
second, if the drop-out pattern in your trial is different between arms (as you say it is), then a naive analysis is likely to be biased, indeed.
one solution I know of is to estimate the probability of censoring in each arm given factors that predict it (say, triglyceride levels), and then use inverse probability weighting (IPCW). theoretically if you now go and do your primary analysis (any analysis, rmanova or glmm) weighted by the IPC-weights, then it should adjust for differential censoring and debias your analysis in that regard.
Im thinking that if dropouts are due to subjects developing excessively high triglyceride levels in the treatment group then they are MNAR and even the mixed effects model might not be sufficient. Would multiple imputation be the best bet?
It is very hard for this design to survive so many dropouts. Just speaking generally though if you measure people frequently enough, MAR may hold, and at any rate may be the best you can do. You have to be sure to use a continuous-time model with continuous-time covariance pattern. Don’t even think about doing “repeated measures ANCOVA”.
1 Like
Dear professor @f2harrell . I have similar doubts. My boss conducted an RCT study investigating the association between health guidance and the incidence of cardiovascular disease. Participants were randomly divided into two groups: one received intensive health guidance, and the other received standard guidance. They were then followed to observe the incidence of cardiovascular disease.
Unfortunately, in the later stages of the study, about half of the regions refused to provide updated data on cardiovascular disease incidence. However, they did provide data on incidence within the first one or three years after baseline.
After consulting with statistical experts, the recommendation was to use baseline data (such as age, blood test results, etc.) to calculte inverse probability. Then, using the subgroup that did provide long-term follow-up data, apply the weights and analyze using a Cox model.
This approach feels a bit odd to me—especially the idea of analyzing only the half population. But perhaps that’s just due to my limited understanding. I’d really appreciate hearing your thoughts on this. In this case, which is better, multiple imputation or inverse weighting? Or is there any other better method? Thank you!
I’m no expert on inverse probability weighting, and worry about its efficiency, but it may be applicable. Or assume that the model for shorter-term follow-up extrapolates reasonably well to the longer time frame (in terms of survival distribution shape) and use all available data (with varying censoring times) from each region.
1 Like