Dear community,
I have fitted a Cox model with a 666 observations dataset with good results.
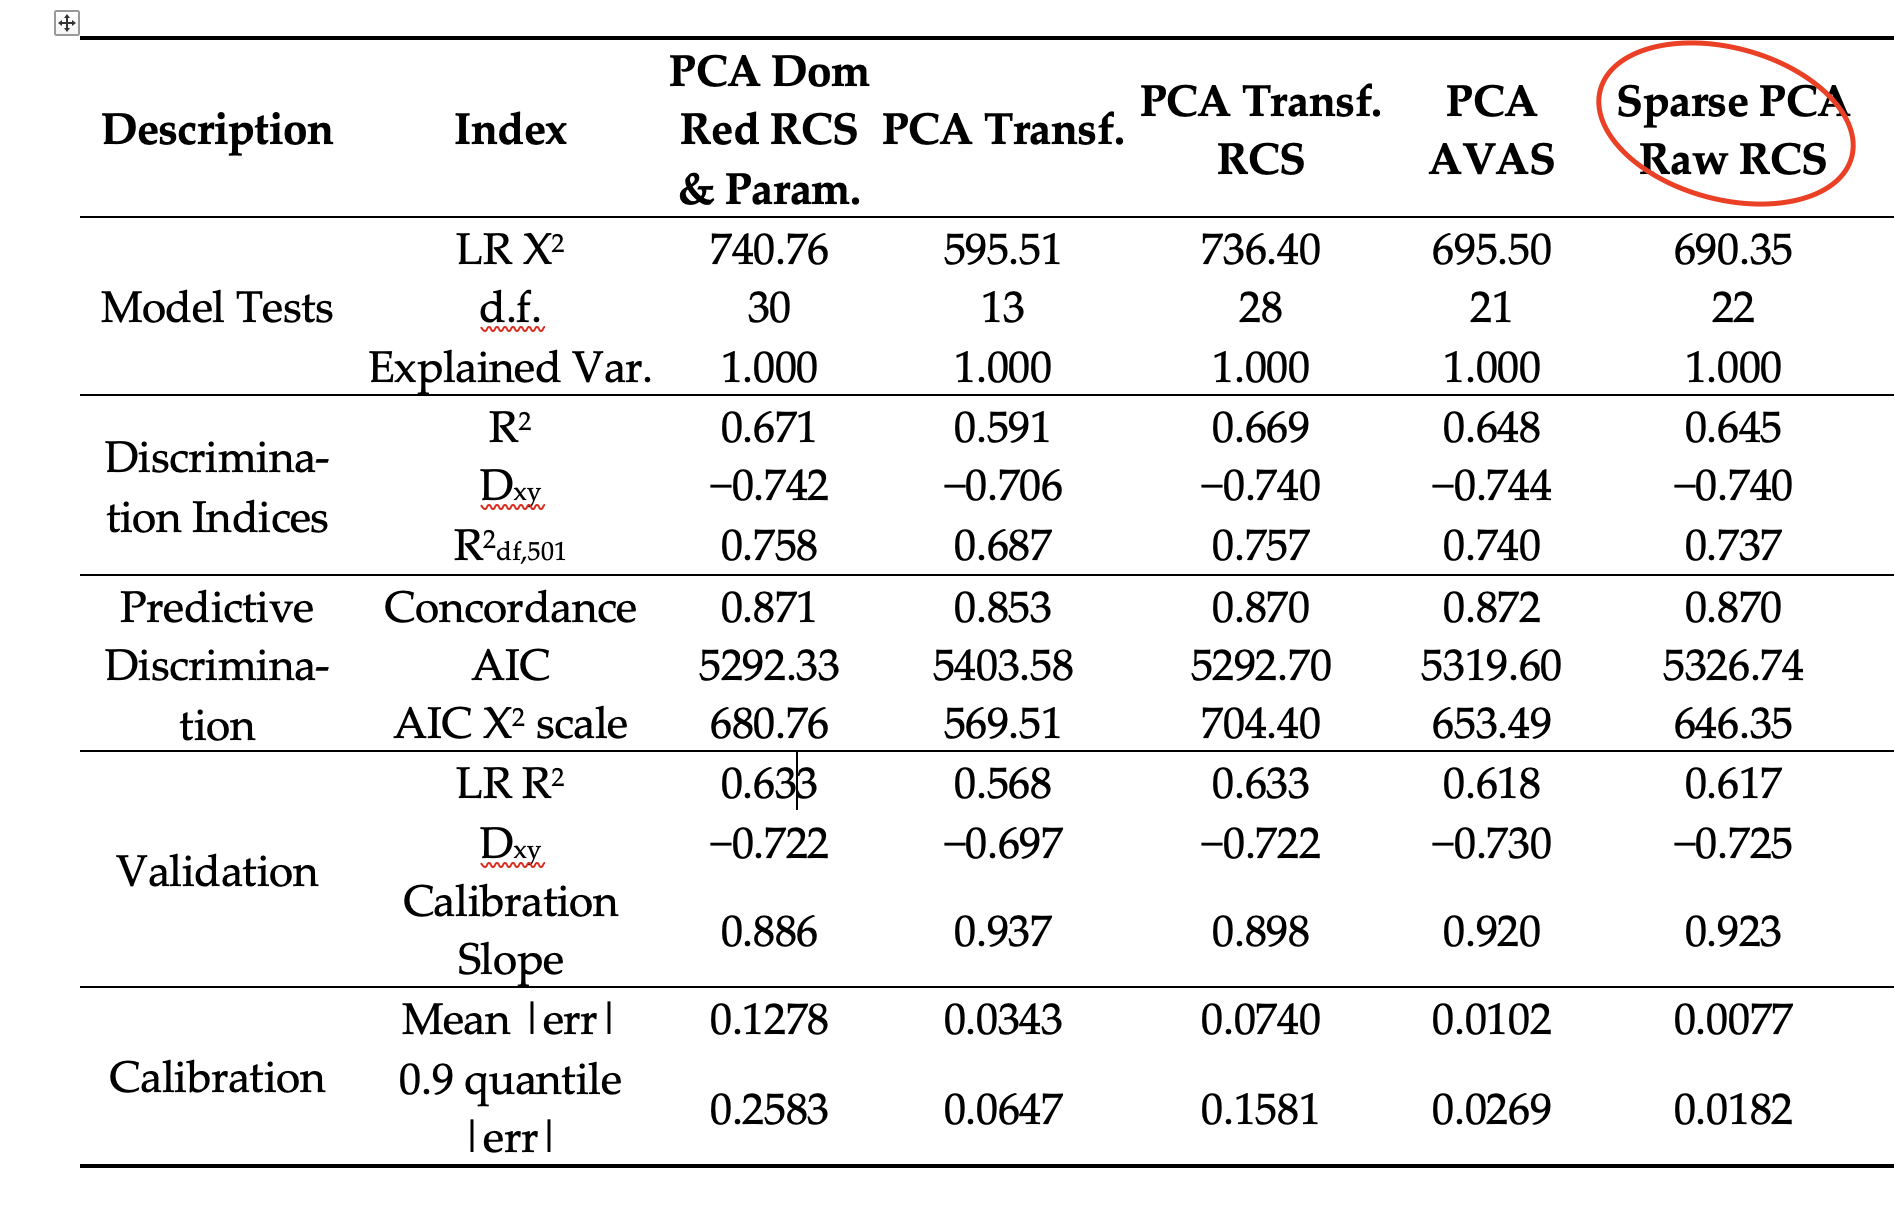
original model using the whole dataset (666 observations)
Now I need to carry out a research of a subset of the original dataset, which comprises around a 75% of all the original observations. I thought that it would be better to fit again the model, with only the “relevant” observations (items) but I see that the performance is worse than the original model.
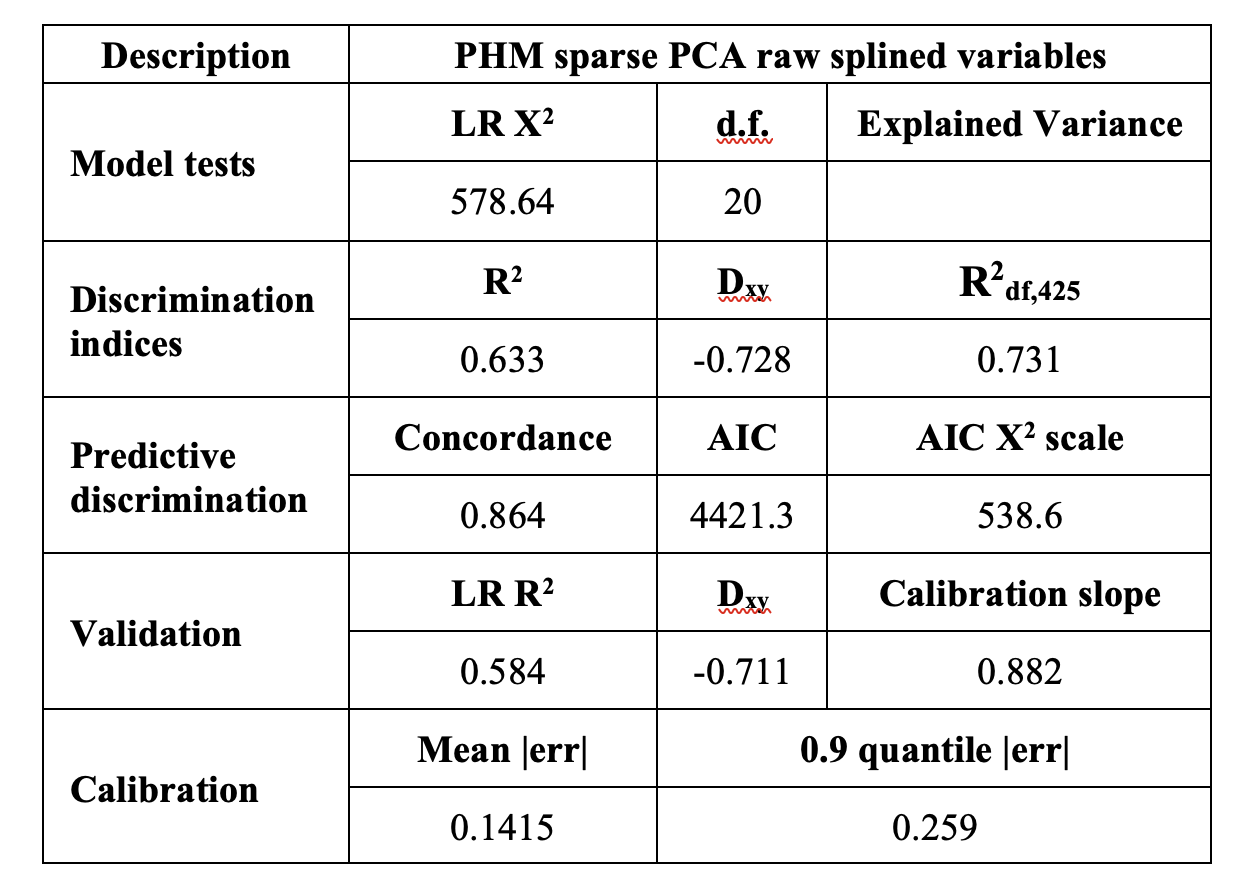
Model fitted using the ‘relevant’ observations (577 observations)
Which model should I use?
An idea would be to use the global model and calibrate/validate it with the reduced dataset to see how it performs, and if it works better than the reduced one then use it in my research, but I am not sure.
Can you please help me in solving this issue?
Thank you for your help
First of all, the tabular summaries you provide are amazing—very comprehensive and insightful. One of many things they help us understand is that rank measures such as concordance probability c (generalized AUROC) should be de-emphasized because large differences in deviance can lead to small differences in c.
To your question, it may be a general issue. Consider a hypothetical example where the predictors are age and sex, and sex is a powerful predictor. Subsetting the data on females will take away the predictiveness of sex leaving only the predictiveness of age in males, resulting in a lower R^2 for non-interesting reasons. Does that kind of analogy apply to your case?
1 Like
Hi professor,
as always, thank you so much for your quick reply and insightful comments, they are extremely valuable.
Regarding the case I am analyzing, the variable affected by the research is categorical, with 6 d.f. and I want to remove the items of one specific category for my analysis. The subset I want to remove from the research includes subjects with an special design (in my case I analyze machines) that differs from the other 5 categories.
The variable is not a specially powerful predictor globally in the model but, considering the domain knowledge of this matter, the survival times of the removed category could be different from the others when stressing other variables (this is what I want to study).
What I am surprised with is that the error of the calibration curve is much higher in the model fitted with the subset, which I don’t reach to understand. Conversely, the survival trend outcomes appear more consistent when the model is fitted using only the relevant subset of data.
It’s being difficult to find the better way to proceed but maybe the best solution may be to use the model fitted with the complete dataset and check its calibration with the filtered data? ← I don’t know if it’s possible to do this with rms:: validate() function.. 
Normally questions like yours are answered with interaction terms included in a full dataset model. Secondly, what is the number of events in the whole sample and in the reduced sample? Bootstrapping will penalize more if the effective sample size is much reduced.
The core validation routine predab.resample used by validate and calibrate does have a subset= argument you can pass from validate and calibrate. You should be able to do something like
validate(f, B=400, subset=mydata$x == 3)
Hi,
in full dataset: 666 observations and 501 events. Subsetted dataset: 577 observations and 425 events.
Both models are fitted after restricted cubic splines conversions and PCA have 21 d.f. A shown in the tables, the slope in the model fitted with reduced dataset is silghtly lower than the full dataset model (0.882 vs 0.923).
Regarding the interactions between variables became very confusing for me when I tried to face the process. Too many variables using cubic splines and I did not succeed.
Finally, I ran the validation and calibration (subsetting relevant data) on the model fitted with the full dataset and the results are more or less the same than the obtained using the model fitted only with the relevant data. I deduce that the problem may be the reduction in the number of observations and events when using the subset.
1 Like
Good work, and keep in mind that the change may possibly also be related to a shift in a covariate distribution.
1 Like