I was last month in a conference and I saw this sort of graph in a new study about myeloid Leukaemia.
Would anyone know the name of this graph?
Tks in advance!!!
I was last month in a conference and I saw this sort of graph in a new study about myeloid Leukaemia.
Would anyone know the name of this graph?
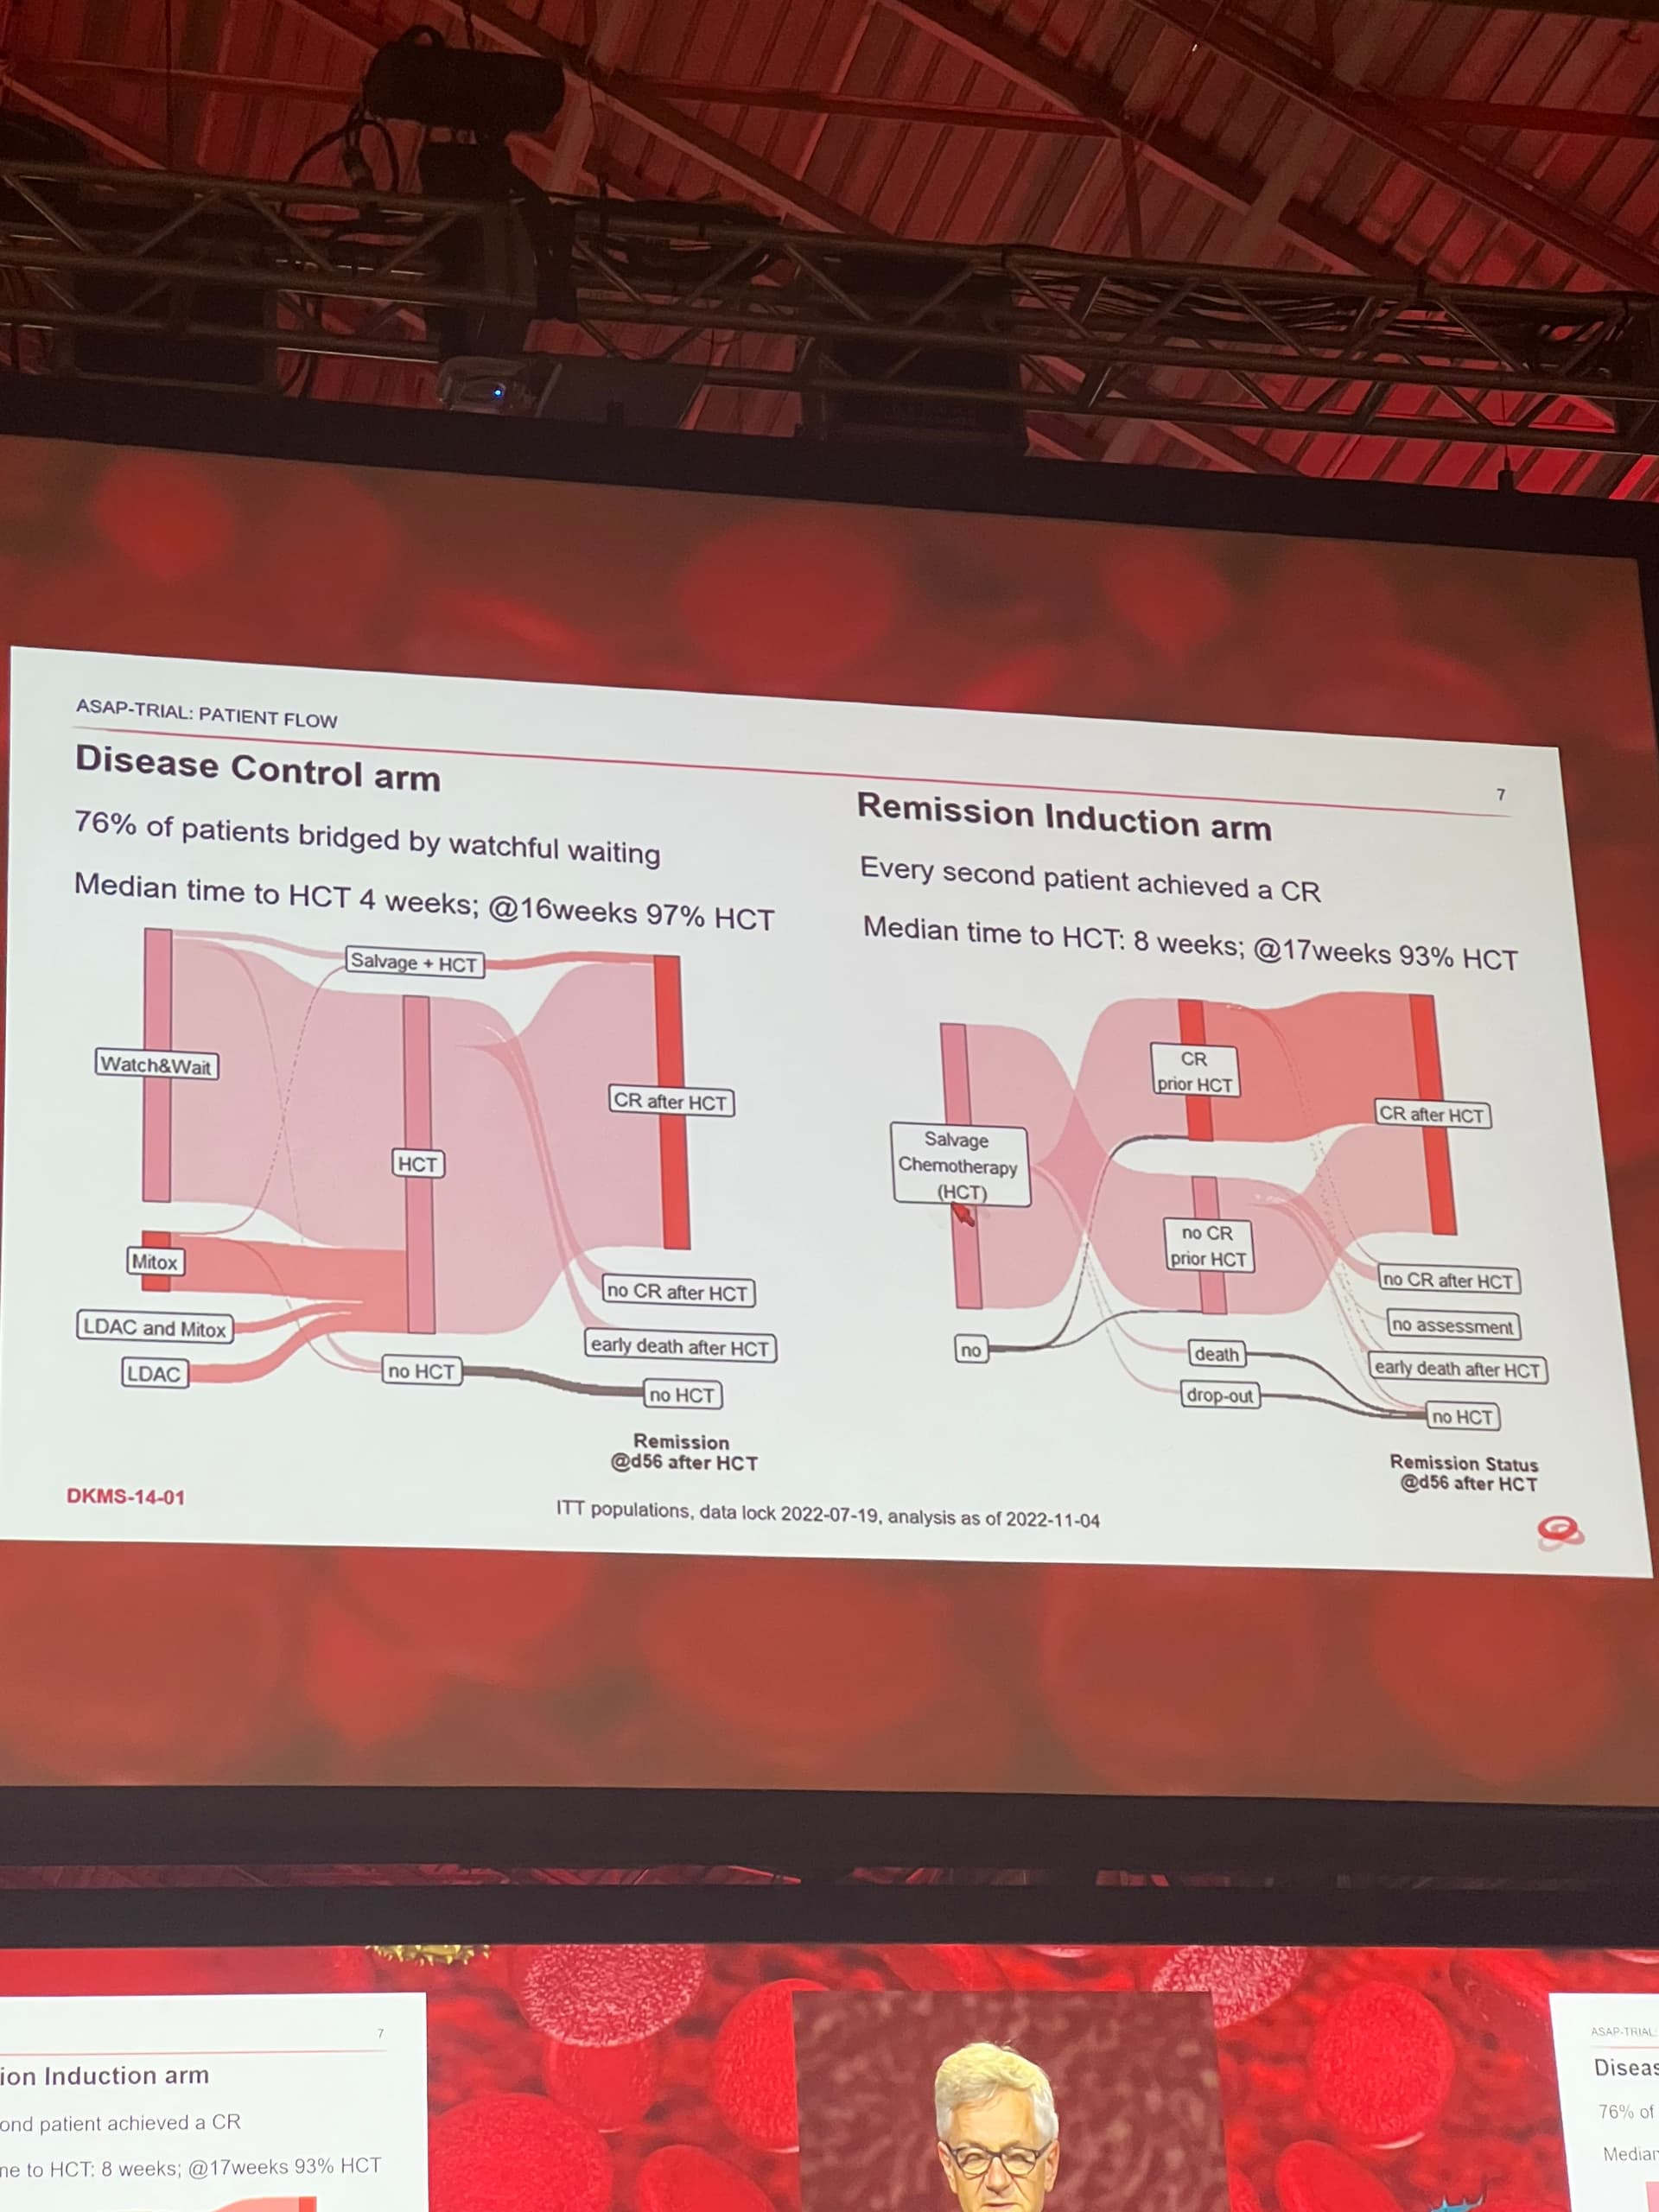
It’s looks to be some type of Sankey Diagram.
This can be recreated in R using the network3d package.
This particular variant is also called an alluvial plot or diagram.
It is called Sankey diagram.
Huifang