The Celebrate trial of Zalunfiban for STEMI in MI has a very peculiar endpoint. A bunch of CV outcomes and then the last component is “not having any of the outcomes”
In the “Statistical analysis and analysis populations” section is the following:
The primary efficacy analysis will compare pooled doses 1 and 2 vs placebo. The primary outcome measure will be analyzed using a proportional odds model with treatment group fitted as covariate and adjusting for age, heart rate, blood pressure, and infarct location (anterior, nonanterior). The adjusted treatment odds ratio estimated from the model and 95% confidence interval (CI) will be presented along with the 2-sided P-value for superiority.
There is additional detail provided in that paper beyond the snippet above.
It would appear that they have defined an ordinal rating/ranking scale based upon clinical judgement as to the relative severity of each of the 6 component clinical events at 30 days, from “worst to least bad”, where the lack of one of the six defined events is the base or reference level for the primary endpoint.
I guess the issues with this outcome are (a) the ordering of severity of events - does everyone agree on that? It looks to me (very much not an expert) that people might disagree; (b) the categories in the ordinal outcome don’t represent states that a patient would proceed through, in the way that (say) the WHO covid scales did. [I think!] I don’t think you would expect someone in state 3 (recurrent myocardail infarction) to worsen to state 2 (haemorrhagic or ischaemic stroke) or get better to state 4 (acute stent thrombosis). That presumably has implications for modelling the outcome (which I haven’t thought through).
Regarding “proceed through” you can have a simpler state transition model perhaps if the transitions are simple, but to do an assessment of which treatment gives better patient outcomes all you have to do is to get consensus on which states are worse than which other ones, regardless of how the transitions occur.
That sounds simple on the face of it, but it seems to me that this type of ordinal outcome (where the levels are discrete events rather than measures of severity of the same event) would be a candidate to run into Thomas Lumley’s “LOCT DOOR”:
an ordering on outcomes for individuals doesn’t imply an ordering on distributions of outcomes for groups
Just as with the Wilcoxon two-sample test, the method rests on being able to order severity of outcomes within patients, and does not depend on doing so for groups.
Agree that the method depends on ordering severity within patients, but the answer to the question that the trial poses (is treatment “better” than placebo?) depends on ordering distributions of outcomes between groups.
We can get consensus that one death is worse than one non-fatal myocardial infarction which is worse than one angioplasty; the individual outcomes genuinely are ordered. This doesn’t tell us is whether one death is worse than two non-fatal myocardial infarctions or two angioplasties. Comparing two groups of people requires us to make both sorts of decision.
(emphasis in original)
If the proportional odds assumption holds this is not a problem, but in this study it doesn’t seem obvious that it does:
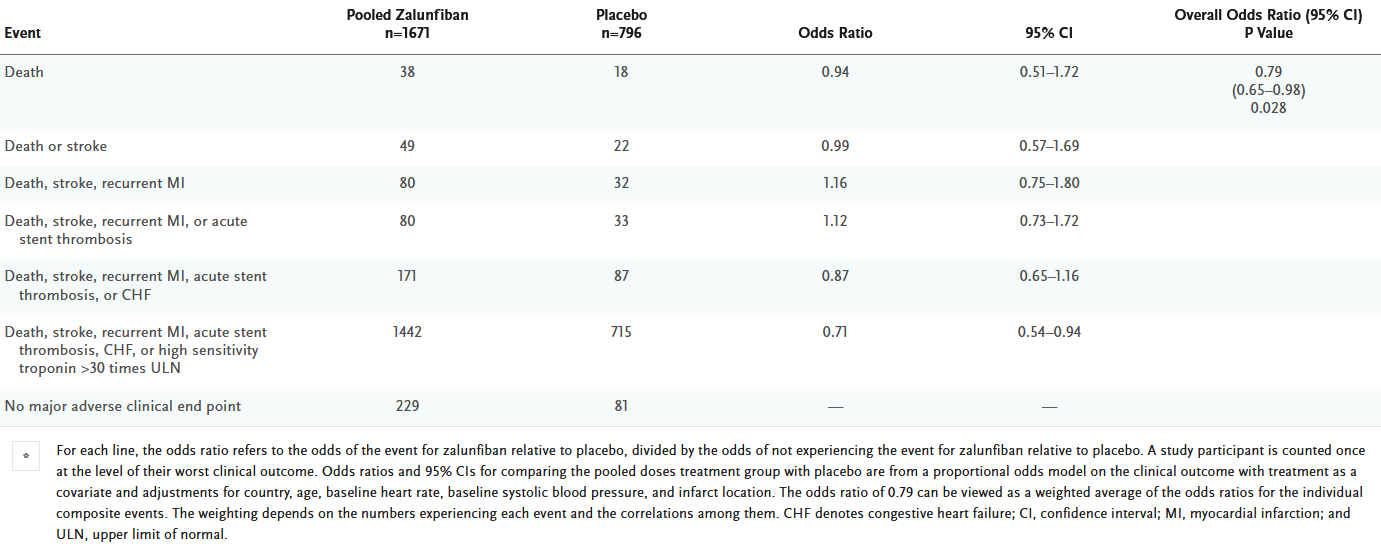
The main result seems to be driven by reductions in acute stent thrombosis, heart failure and high post-MI troponin, but recurrent MIs were more common in the treatment arm. Death and stroke were rare but occurred at similar rates in both arms.*
You would need clinical expertise to say whether the possible increase in risk of recurrent MI is small enough to justify the reductions in risk for the outcomes that were considered to be less important. In other words, I don’t think it’s as simple as saying: (1) we have an unambiguous ordering on outcomes within patients, and (2) we’ve shown an odds ratio < 1, therefore treatment is better than placebo.
[* I can see the large uncertainty on the cumulative odds ratios and am aware that the CIs are consistent with a common beneficial treatment effect. It is just an example to illustrate the point in this particular study; you can probably imagine other settings where a treatment impacts ordinal outcome levels in opposite directions — e.g., antibiotic effectiveness vs toxicity]
I’m not arguing against ordinal outcomes, but I am trying to make sure that I understand the implications of this kind of analysis, because I don’t think it is always as simple as it seems at face value.
Prof Lumley went into more detail on this question in his Belz Lecture this year. He posted his slides & notes here:
Not addressing the proportional odds assumption, we can avoid the groups problem. The Wilcoxon test and its generalization the proportional odds model assesses whether a randomly chosen patient in group 1 has a response that is higher than a randomly chosen patient in group 2. No group comparisons are used or are needed.
The other issues may largely be taken care of through the miracle of longitudinal assessments. We may not have a magic criterion for what is considered to be a good or a bad outcome but we can compare treatments with regards to change in expected time in a given set of states, doing this for more than one set of states. For example we may estimate the reduction in mean time in hospital or with an MI or dead, or reduction in mean time with MI or dead.
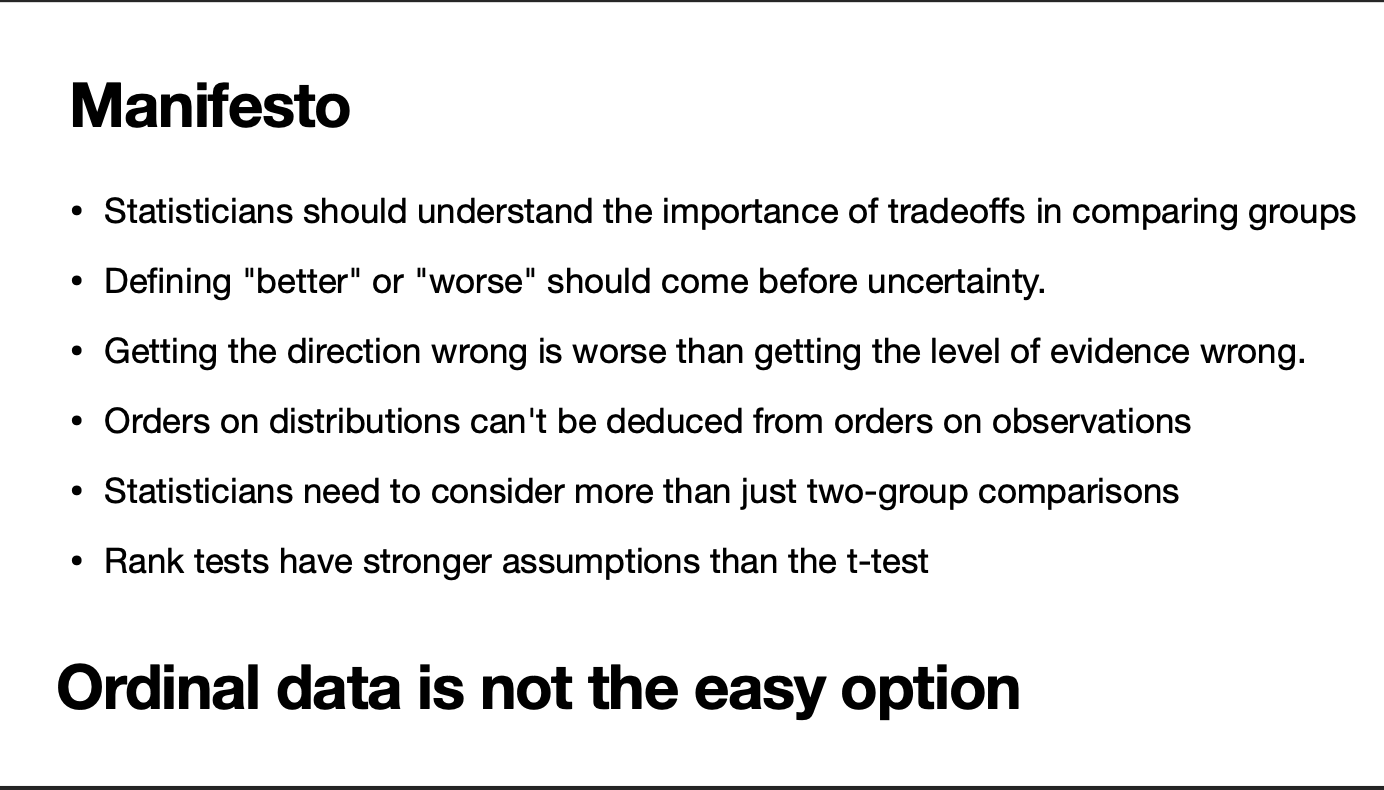
The statement “Rank tests have stronger assumptions than the t-test” is demonstrably incorrect. The t-test makes all the assumptions of the normal scores rank test, plus it assumes normality. The equal variance assumption is exactly analogous to the proportional odds assumption with logistic models.
I’m not sure if I’m being dense, but what is the substantive difference between (a) comparing the outcomes of “a randomly chosen patient” in each group and (b) comparing the distribution of outcomes between groups? To me, with random assignment, (a) is just another way of wording (b).
As a more concrete example, suppose the group distributions (or outcome probabilities for a randomly chosen patient) look like:
Group A: 25% no AE, 75% minor AE, 0% serious AE, 0% death Group B: 50% no AE, 25% minor AE, 25% serious AE, 0% death
The ordering of outcomes is unambiguous and a randomly chosen patient in Group B is more likely to have a better outcome than a randomly chosen patient in Group A (37.5% vs 31.25%; with 31.25% chance of a tie). But a randomly chosen patient in Group B is substantially more likely to have a serious AE than one in Group A. So the decision of which group is “better” probably depends on how much worse it is to have a serious AE – i.e., we need to think about the relative importance of the outcomes, not just their ordering!
I know the fact that the proportional odds assumption does not hold should mean that we don’t just draw conclusions from a single-number summary of the between-group comparison. I’m just saying that “to do an assessment of which treatment gives better patient outcomes all you have to do is to get consensus on which states are worse than which other ones” is an oversimplification, because it ignores the fact that we do need to compare distributions between groups (however you wish to frame it).
Re the rank test assumptions point - I wasn’t at the lecture and I don’t want to put words in Prof Lumley’s mouth: he is a far more skilled statistician & communicator than I am. But I think this was referring back to the points made around the “rank tests don’t respect ordinal scale” slide. It would be great if he was on this forum to clarify it.
I don’t know if I’m just being partcularly stupid, but I don’t really get Thomas Lumley’s criticism. The trade-offs between different outcomes exist however you choose to do the analysis - they’re still there (and often unadressed) if you do a traditional one-outcome-at-a-time analysis. I feel I’m missing something important here.
Again, I don’t want to speak for him, but I think his main point is the last one in the Manifesto slide: “Ordinal data is not the easy option”. He is cautioning against the idea that being able to unambiguously order the outcomes implies we can unambiguously order the groups. That implication seems to have been made a couple of times in this thread (possibly unintentionally, sacrificing nuance for the sake of brevity), and I think it is an easy trap to fall into when you encounter ordinal outcomes. I agree that trade-offs exist either way and probably the method of presenting the results can make them more or less obvious.
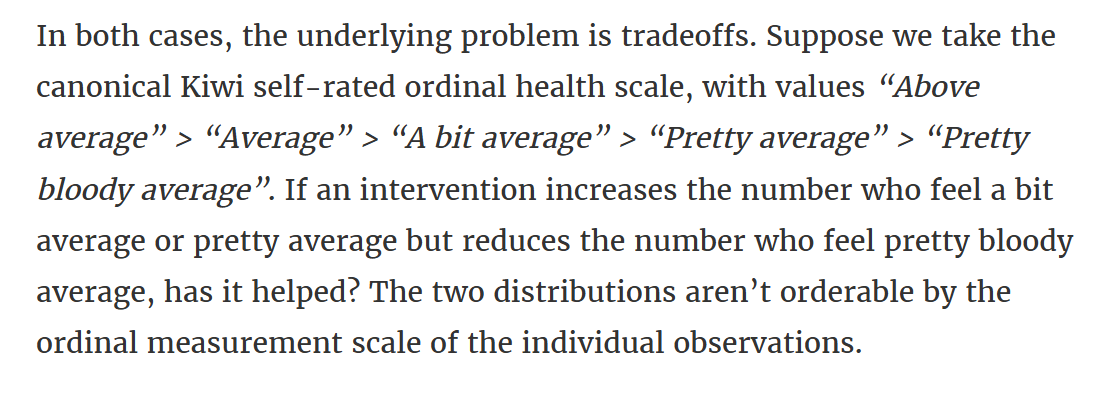
I think it’s a “yes” if there are fewer ‘pretty bloody average’s because those individuals’ outcomes were improved; hence more ‘a bit / pretty average’s. But I think he is imagining a situation where individuals’ outcomes are generally worsened by the treatment (more ‘a bit / pretty average’s) but don’t reach the highest level as often (fewer ‘pretty blood average’s). Similar to my example above of a treatment that increases the total number of AEs but those AEs tend only to be mild.
To be clear, I generally agree that ordinal outcomes (and longitudinal assessment of them) are a promising approach for clinical trials, and I’m happy to see that they are becoming more popular. I just want to make sure that I understand the pros and cons, and best method of analysis & interpretation, for when I have those discussions with clinicians. Particularly with outcomes like this study – where, as you said, a patient wouldn’t generally ‘progress’ through the levels – because an assumption of stochastic dominance might be on less solid ground [than England’s top order? ].
I love this kind of discussion and hope to see it continue as these issues are incredibly important to the design, analysis, and interpretation of clinical trials.
For more than 4 decades I have revered Thomas Lumley’s skills and wisdom as a statistician, so it is with trepidation that I criticize any aspect of his writings or presentations. The one bullet point I strongly disagreed with could have had another meaning in full context, but standing by itself is problematic since parametric models are special cases of semi-parametric ones where not only the link function is known but the per-group distribution is known. If both are known and the response variable Y is continuous and is interval-scaled (a lot to ask) then a parametric test such as the two-sample t-test can possibly yield the correct answer to the clinical question of which treatment is better.
We can’t really know which treatment is best for a given type of patient without knowing that patient’s utilities for all possible outcomes. Then we can apply those utilities to an ordinal model to estimate the expected utility under either treatment option, to choose the best treatment for that patient (assuming the ordinal model correctly specifies any substantial non-proportional odds).
Since the proportional odds (PO) model is equivalent to the Wilcoxon test whether or not PO holds, both methods are guaranteed to tell us that treatment B is worse than A under the (what some of you may consider narrow) criterion of P(Y_{Bi} > Y_{Aj}) > \frac{1}{2} for random i, j, assuming higher Y means a worse outcome. Group comparisons do not come into the picture except in a special case where it doesn’t matter: every patient in a given group has the same outcome distribution (patients are homogeneous within groups) because either there are no covariates related to the outcome or because every patient has the same covariate values. In that special case the observations within a group are exchangeable and group determinations of ordering (as computed by @mdonoghoe) are identical to expanding the proportions he listed into raw data for Y and computing the Wilcoxon statistic in the usual way.
This kind of thinking is what is almost always forgotten when non-statisticians reject statistician’s designs because of their perceived overcomplication. What we have seen in interpretation of multiple outcome components over the past 50 years, starting with the first clinical trial I worked on (Lipids Research Clinics Program to test whether a cholesterol reduction drug improved cardiovascular death or MI, 1973-1978) where an overall drug benefit (after fudging the borderline p-value but that’s another story) was driven by nonfatal myocardial infarction (where MI adjudication was possibly not fully blinded to treatment assignment). The classic analysis of time to first event considered nonfatal MI equally bad as death which is always a mistake IMHO. We see even more often a bunch of disconnected analyses of the various endpoints followed by an incredibly subjective amalgamation of those results by clinical investigators in an ad hoc attempt to make conclusions about treatment recommendations. Ordinal models, though imperfect, are decidedly better than this, while we await utility studies (using rigorous time-tradeoff of willingness to pay elicitation, for example) to be done so that we can better weigh all the individual outcomes. These utilities can be applied to ordinal longitudinal models to obtain expected utilities at a fixed time or expected utilities averaged over follow-up time.
Side note: We can’t apply utilities to raw data and then analyze the results parametrically because the utilities have a discontinuous distribution with lots of clumping of values, floor and ceiling effects, possible bimodality, …
A couple of recent things that I’ve come across on this topic.
I was re-reading Prof Lumley’s post about his Belz Lecture and there was a section that I either missed the first time around or was added later. One of the points very briefly mentions @f2harrell (bold emphasis mine)
Issues that came up in questions or afterwards
I should have made it clearer that it may not be the statistician who evaluates the tradeoff. For example, in medical treatment it would ideally be the individual patient. In government it may be the Minister rather than the official stats agency. The statistician’s job is to make sure that people know evaluating the tradeoff is needed.
This is a lot like other utility tradeoffs: eg equity vs number of people helped in public health. Someone needs to decide; the problem can’t just delegated to maths.
Someone (?Cameron Patrick) asked about how this differs from Frank Harrell’s views and why. I think (having given a version of this talk at his department and talked to him about this) that Frank regards failures of ordering as less important and less plausible than I do. He has also been more interested in ordinal scales as a way of pushing back against dichotomisation in medical statistics.
Also, Berry Consultant’s latest “In the Interim” podcast episode is quite negative about proportional odds models for ordinal outcomes. Their main contention seems to be that (as opposed to explicitly assigning values to the ordinal levels and analysing it as an interval measure), the PO model implicitly assigns these values as a function of the observed frequency of the outcomes. The article presenting this is still in development, but I think the argument is based on comparing the PO model’s score statistic to that from a t-test of the weights. My initial reaction is that this argument isn’t overly compelling, but I need to think about it a bit more…
I listened to that “In the Interim” episode yesterday, so it’s fresh in my mind. I didn’t take such a negative message from it - I think the main issues with the proportional odds model were (a) it wasn’t a good model if you expected the intervention to increase the outcomes at both ends of the scale (e.g. full recovery and death); (b) they had had a specific criticism of the utility-weighted approach that weighting of the ordinall categories was not a good idea because everyone would differ in their utilities (and therefore a proportional odds model is preferable). Scott’s argument was that in fact the proportional odds model is also weighted in ways that you might not like, but it’s just hidden,
Scott did say (I think) that they did use proportional odds models in e.g. REMAP-CAP (presumably the issue of increasing both ends of the scale doesn’t apply??).
The Berries also use a slightly modified version of the Markov State Transition Model @f2harrell has proposed for REMAP-CAP (active since November 2024; see page 10 of the PDF below). So I doubt they think ordinal models are bad.
I’ve also seen @kertviele argue against people dichotomizing ordinal scales such as the modified ranking scale, because that way you automatically declare states below, respectively above the cut-off to be equally bad / equally good. Is this worse than the common odds ratio being driven by the frequency of each category? I would tend to think so.
Lastly, what appealed to me as a clinician about the longitudinal ordinal model was how easily you can derive clinically relevant estimates. Such as differences in the time alive and out of hospital, or any contrast you really wish for. The issue is of course that under PO, the treatment effect, if present, will be biased because the most prevalent states drive the common odds ratio. On the other hand, as a clinician I’m also often happy to borrow some information for rare outcomes using the PO assumption, but that depends on the research area.
This is a great discussion. One of the most important benefits of the PO model (and other models in the cumulative probability model family) is that even when the parallelism assumption is grossly violated, the model still tells you which treatment is better from a stochastic pairwise ordering perspective. The standard error of the log odds ratio may be screwed up, but the sandwich estimator is likely to fix that. Better: put a prior on the amount of non-PO.