Consider the following illustrative example, which gives all-cause mortality rates according to age and vaccination status:
1-3 doses
4 doses
Ever vaccinated
Young
300 (300 / 100 000)
1 500 (15 / 1 000)
312 (315 / 101 000)
Old
6 000 (600 / 10 000)
3 000 (300 / 10 000)
4 500 (900 / 20 000)
The numbers in parenthesis indicate the number of deaths and the size of the population in a particular cell, and the number before the parenthesis is the death rate (in /100 000 person-years) based on these.
Let’s use the following standard population: 80% young, 20% old. With this, the standardized death rates are the following:
Number of doses
Standardized death rate
1-3 doses
1 440
4 doses
1 800
Ever vaccinated
1 150
What is surprising is that the rate in the combination of individual groups is lower than the rate in either of the groups.
My first thought was that this is an example of non-collapsibility. Unfortunately I am no expert in that area, and I mostly read about it in relation to odds ratio (see for example Frank’s article here), so I am not entirely sure. Is it just a superficial resemblance, or there is indeed some structural similarity of this example and those about the non-collapsibility of OR…?
I vaguely remember the while relative risks are collapsible hazard rates aren’t. Since standardized rate is usually estimated with poisson with log offset and this estimates exponential hazard I wonder if there’s something there?
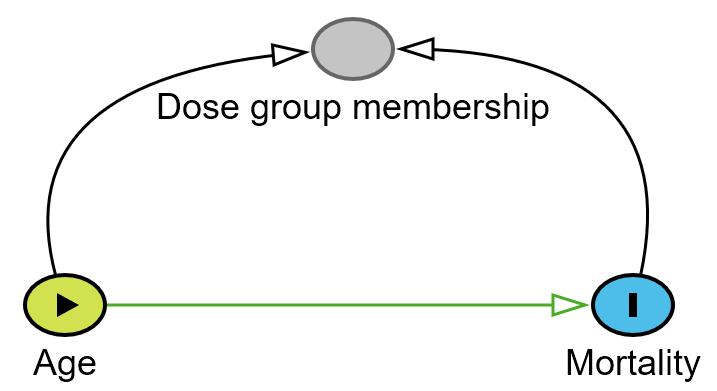
@s_doi may also be right but I’ve never really understood DAGs like the one shown since it doesn’t make sense as a data generating process (mortality probably can’t reasonably cause dose group membership).
Isn’t the standardized rate between the groups? For example, 1,440 is between 300 and 6000. What do you mean to be lower than each group?
I was referring to the standardized rates themselves. The standardized rate of the (combined) “ever vaccinated” group, a combination of “vaccinated with 1-3 doses” and “vaccinated with 4 doses” is lower than that of 1-3 doses and 4 doses.
I vaguely remember the while relative risks are collapsible hazard rates aren’t. Since standardized rate is usually estimated with poisson with log offset and this estimates exponential hazard I wonder if there’s something there?
Hmm, that’s an interesting idea, and I haven’t thought of this, but i don’t really see how it can help us: as far as I know, a Poisson GLM can be used instead of traditional standardization (and is indeed much better in many respects), but so far I thought that it is not is possible to exactly reproduce traditional standardization with regression. (I.e., it is not a generalization.)
So we can say something along the following lines:
SimData <- data.frame(Age = c("Young", "Young", "Old", "Old"),
                  Dose = c("1-3", "4", "1-3", "4"),
                  Death = c(300, 15, 600, 300),
                  Pop = c(100000, 1000, 10000, 10000))

fit <- glm(Death ~ Age + Dose, offset = log(Pop),
       data = SimData, family = poisson(link = "log"))

summary(fit)
exp(coef(fit))
…but I don’t know how to proceed from this point, or how does it help us.
Even if the diagram would be perfect, I am not sure I see how it helps us answering the question, but frankly, I don’t really understand the diagram to begin with. What do you mean by mortality impacting the dose group membership? Also, it seems to me that the interaction between age and dose group membership (e.g., young people vaccinated with 4 doses have very poor outcome considering their age) is important in this story, but I don’t see how it appears on your diagram.
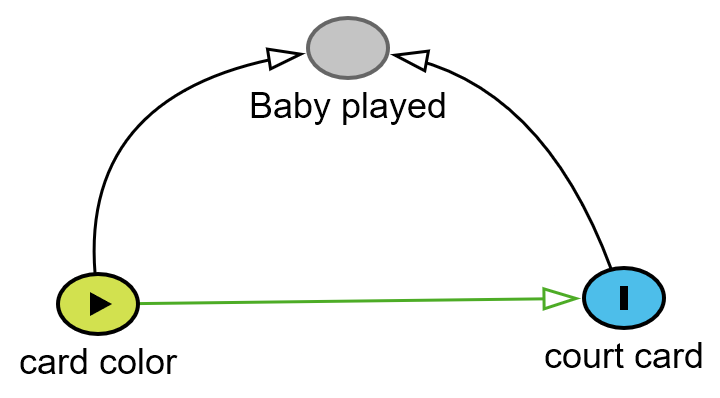
Reminded me of Simpsons 1951 paper where he discussed the fact that there was no association between color of a card and type (court card vs plain card) unless we selected based on baby having played with the cards - then an association was seen. In reality, the cards selected by the baby had the biased results and the unconditional results (whole pack) were the correct results. The arrows should be interpreted as “selected into” or “leads to the baby playing or not”.
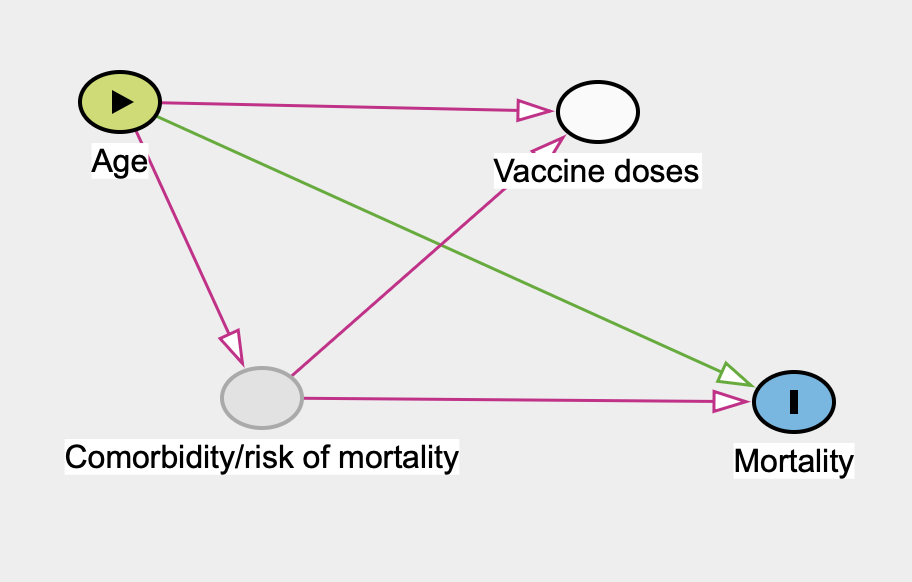
I also immediately thought of Simpson’s original paper and example but fail to see how vaccine dose can be a downstream effect of mortality (mortality causes number of vaccine doses doesn’t make any sense). I don’t think this is caused by conditioning on a collider. My feeling is that the following DAG is a justifiable DAG for the “problem” at hand, where comorbidity is an unobserved variable. The reason I put quotation marks around “problem” is that there is no stated question and therefore no way to justify any DAG or adjustment set.
Are we sure this is a paradox rather than a logical error? Let’s start by confirming that the problem lies with the standardized portion of the data. Before standardization the death rate was 900/110,000 x 100,000 = 818 for 1-3 doses, 315/11,000 x 100,000 = 2,863 for 4 doses and 1,215/121,000 x 100,000 = 1,004 for the combined group ever vaccinated, which is approximately the relationship you would intuitively expect.
Now lets work through the standardized data. We’ll start with 1-3 doses. We imagine a sample of 100,000 persons who received 1-3 doses, of which 80,000 are young with a mortality rate of 300/100,000 and 20,000 are old with a mortality rate of 6,000/100,000. Of this 100,000 person sample, 8,000 x 300/100,000 + 2,000 x 6,000/100,000 = 1440 will die.
Next we imagine a sample of 100,000 persons who received 4 doses, of which 80,000 are young with a mortality rate of 1,500/100,000 and 20,000 are old with a mortality rate of 3,000/100,000. Of these 100,000 persons, 80,000 x 1,500/100,000 + 20,000 x 3,000/100,000 = 1,800 will die.
Now we have all the information we need to calculate the number dead and importantly the size of the combined group ever vaccinated, which is 1440+1800 = 3240 dead among a sample of 200,000 individuals, which equals a mortality rate of 1620 per 100,000. This doesn’t agree with the surprising ever vaccinated rate provided in the table. We will however note that 1620 per 100,000 is exactly the result that intuition would have led us to expect.
So now let’s work backwards and start with imagining a sample of 200,000 persons who are ever vaccinated, of which 0.8 x 200,000. = 160,000 are young with a mortality rate of 312/100,000 and 0.2 x 200,000 = 40.000 are old with a mortality rate of 4,500/100,000. Of these 200,000 persons, 160,000 x 312/100,000 + 40,000 x 4,500/100,000.= 2,299.2 will die, i.e. a mortality rate of 1,150 per 100,000. Which is the surprising result given to us in the table.
As far as I can tell, the surprising result is therefore due to first calculating a weighted average of the mortality rates for young and old persons who have received 1-3 doses and 4 doses and then afterwards applying age group standardization to the mortality rates of those who have received 1-3 doses and 4 doses independently to the old weighted average, which no longer applies to the age group standardized rates for 1-3 doses and 4 doses.
I don’t think this is an example of non-collapsibility.
Thanks for this calculation! I am still trying to understand it, I don’t yet have a clear picture, but I surely understand what did you mean by “error”: that’s indeed how we calculate “ever vaccinated” (adding the groups), and that’s indeed how we standardize (applying the standard population’s weight), so where is the “error” in this calculation…?
I might be totally wrong, but my first impression is that what you did (that resulted in 1620) is a sort of “double standardization”. In addition to the 80% young, 20% old standard population, you implicitly assumed a 50% with 1-3 doses, 50% with 4 doses standard population, considered these to be independent, resulting in a 40% young with 1-3 doses, 10% old with 1-3 doses, 40% young with 4 doses, 10% old with 4 doses standard population and then you applied to standardization to the whole two-dimensional table (0.4 \cdot 300 + 0.1 \cdot 6000 + 0.4 \cdot 1500 + 0.1 \cdot 3000 = 1620 indeed).
My contention is that it is incorrect to take a weighted average of the groups and then independently standardize the groups and their old weighed average. If you wanted to standardize I would assume that you should first need to standardize the groups and then take the new weighted average.
I might be totally wrong, but my first impression is that what you did (that resulted in 1620) is a sort of “double standardization”. In addition to the 80% young, 20% old standard population, you implicitly assumed a 50% with 1-3 doses, 50% with 4 doses standard population, considered these to be independent, resulting in a 40% young with 1-3 doses, 10% old with 1-3 doses, 40% young with 4 doses, 10% old with 4 doses standard population and then you applied to standardization to the whole two-dimensional table…
That was a bad example but I think it generalizes, please correct me if I’m wrong. In your non-standardized example, there are 100,000 young and 10,000 old in the 1-3 dose group and 1,000 young and 10,000 old in the 4 doses group, leading to 101,000 young and 20,000 old in the ever vaccinated group.
If you now standardize all the groups but keep their size unchanged, you get:
110,000 x 0.8 = 88,000 young in the 1-3 dose group, with 88,000 x 300/100,000 = 264 deaths.
11,000 x 0.8 = 8,800 young in the 4 dose group, with 8,800 x 1,500/100,000 = 132 deaths.
121,000 x 0.8 = 96,800 young in the ever vaccinated group, with 96,800 x 315/100,000 = 305 deaths according to the mortality rate calculated by the unstandardized weighted average. If how ever, we use the new standardized weighted average, which would be (264+132)/(88,000+8,800) x 100,000 = 409/100,000, the number of deaths would be 96,800 x 409/100,000 = 396 deaths.
We find that the number of deaths among the young in the component groups 264 + 132 = 396 is higher than the number of deaths among the young in the ever vaccinated group if using the unstandardized weighted average of the mortality rates, but the same if using the standardized weighted average.
110,000 x 0.2 = 22,000 old in the 1-3 dose group, with 22,000 x 6,000/100,000 = 1,320 deaths.
11,000 x 0.2 = 2,200 old in the 4 dose group, with 2,200 x 3,000/100,000 = 66 deaths.
121,000 x 0.2 = 24,200 old in the ever vaccinated group, with 24,200 x 4,500 x 100,000 = 1,089 deaths according to the mortality rate calculated by the unstandardized weighted average. If how ever, we use the new standardized weighted average, which would be (1,320+66)/(22,000+2,200) x 100,000 = 5727/100,000, the number of deaths would be 24,200 x 5727/100,000 = 1386 deaths.
We again find that the number of deaths among the old in the component groups 1,320 + 66 = 1,386 is higher than the number of deaths among the old in the ever vaccinated group if calculated using the unstandardized weighted average, but the same if using the new standardized weighted average.
I’m sure someone here could generalize this to all group sizes of 1-3 doses x and 4 doses y.
By standardizing the age distribution in the 1-3 dose group and 4 dose group to be the same, 80% young and 20% old, you are changing the relationship between the number of young in the 1-3 dose group (88,000/96,800 = 91%) and the number of young in the 4 dose group (8,800/96,800 = 9%), compared to your original sample (100,000/101,000 = 99% in 1-3 dose, 1,000/101,000 = 1% in the 4 dose). The same can be shown for the old. Therefore, the original weighted average of the mortality rates in the 1-3 dose and 4 dose groups that you calculated for the ever vaccinated group, no longer applies to the standardized ever vaccinated group, causing the surprising results.
Your original question remains: can this somehow be labeled as non-collapsibility, or is this just a logically incorrect order of operations?
Thanks! Just one very quick question, just for clarification to make sure I understand you correctly: what do you think, if this is really an error, then what would be the “error-free”, the correct calculation here?
I have re-written my reply to include the correct order of operations but in short, you should first standardize the component groups before you calculate the weighted average of their mortality rates for the total group.