Dear all,
I have a problem regarding modelling strategy of a non-linear effect, as follows. In the plot, the blue line is a smoothed function, the red line would be the linear model.
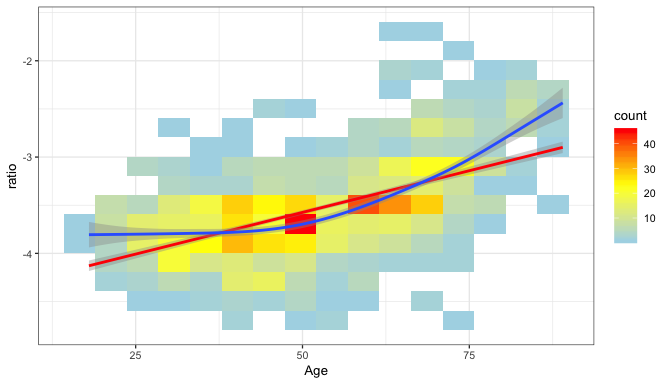
As you can see in the plot, ratio is dependant on age but in a non-linear fashion. I have tried to model it using age^2, but the non-linear effect is still there.
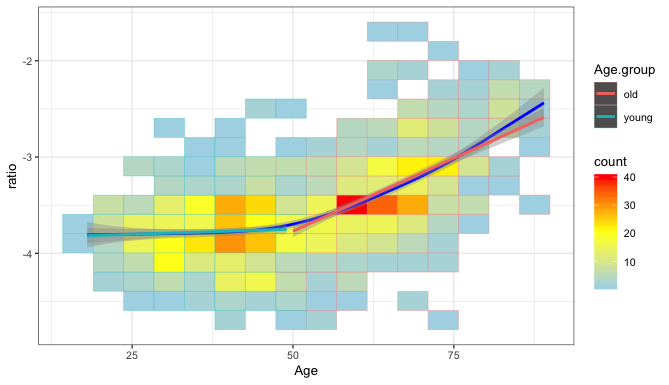
The best model I have come up so far, is to binarize age between young (<50) and old (>50) and fit a linear model through both of them using an interaction term between the age group and the age.
Somewhat this is not very satisfying as the binarization is not based on any biological foundation.
I was therefore wondering if anyone had a good idea for fitting this kind of data?
Thank you in advance!
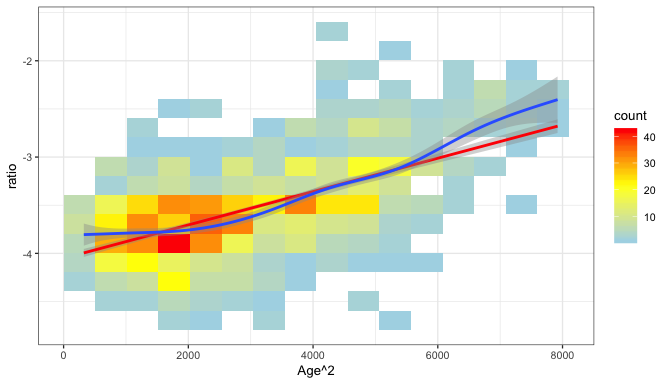
The plot using age^2 looks like following.
The plot using the binarized model looks like this.
In the future it’s best to edit your original post to expand it rather than adding new replies.
The binarized model is not a good choice in my opinion, and the graph you provided with the quadratic fit does not look quadratic to me. I suspect a plotting error of some sort.
The analysis seems to call for a flexible regression spline, e.g., a restricted cubic spline. Details are in my Regression Modeling Strategies book and course notes.
1 Like
Ratios are already problematic variables, and yours are measured on a peculiar scale that has negative numbers (logs?).
It’s almost impossible to be helpful here because we don’t know what the data generation process is supposed to be. I’m imagining a life course model in which something remains pretty steady until your fifties and then starts to change, but you are the only person who can tell us why you expected a linear relationship with age rather than some other shape.
Tell us a little more. I’ve just made coffee and would love to relax by thinking about someone else’s data problems rather than my own!
It looks like you plotted age^2 on the x-axis instead of age. Given that the model is linear with respect to age^2 it makes sense that the model fit curve (red line) is linear. If you use age on the x-axis the model fit curve should appear quadratic.
I’m not getting this, as it doesn’t make sense to model age^2 without simultaneously including age in the model.
Dear everyone!
first sorry for the weird posting format and having been unclear in my explanations and thank you very much for your fast and good answers!
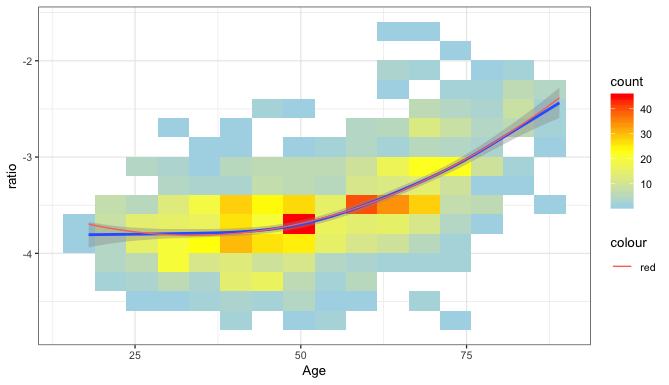
It was indeed a newbie mistake and redoing the plots with your advice (plotting age instead of age^2 and adding age^2+age in the model), a quadratic model seems like an okay fit.
Thank you again for your help!
1 Like
Agreed, the model should have both age and age^2. When plotting the model, though, doesn’t it make sense that it would only appear non-linear (quadratic in this case) when the x-axis is age (vs. age^2)? I think my original explanation/train of thought may have been off base.