Nosek et al paper

Would love to get the opinion of experts on the Nosek et al paper showing that 29 research groups analyzed the same data on same research question and found disparate odds ratios depending on analysis type.

http://journals.sagepub.com/doi/10.1177/2515245917747646

What are the implications for observational research in cardiology and other areas of medicine?

What are the take-homes for the practicing clinician?

5 Likes

John, great to see you posting here.

My initial reactions are:

  1. It certainly provides an example of how the “forking paths” problem manifests in practice. Given a dataset and a question, but no further specific instructions, there are many different choices an analyst/group faces in attempting to answer the question if there was no pre-registration or analysis protocol (and even if there was some form of pre-registration, those same decisions obviously still had to be made at some point).

A cardiology colleague of mine asked about this after they saw your Tweet, and I likened it somewhat to the many paths a patient might take if presenting to the ED with fairly vague, non-specific symptoms (“Chest pain” being a good example). Imagine that same patient presenting to 29 different ED’s across the country. I’d love to see the flow diagram of what would happen to them - i.e. what would be the first test at each place, what would be the interpretation of that test, would a second test be ordered, how many would end up in cath lab, how many would get a stent, etc.

Similarly, given a single question and dataset, it should be no surprise that different statisticians may choose different approaches in response to an open-ended analytic problem.

  1. Just my opinion, but I think the degree of heterogeneity in the effect sizes the groups came up with is being just a little but overstated in any headlines like “They gave 29 groups the same dataset and got widely varying results!” Look at the forest plot (Figure 2) again.

I’m not saying every team’s approach was correct - if I reviewed in detail, I might find bones to pick with any or all of them. But, as with many research-articles-in-the-news, the flashy take-away of “statisticians got different answers with the same data” may cause more alarm than the study outcome probably warrants. I would love to hear other takes, both statistician and non-statistician, on this interpretation.

So:

  1. I think this is arguably a useful illustration of why pre-registration of a statistical analysis plan would be a benefit for many papers built on observational data analyses of retrospectively collected data, and certainly a useful illustration of the benefits of greater methodological transparency.

Pre-registration wouldn’t solve everything, but at least it would prevent people making decisions with a goal of getting the result to move closer to their idea of what the truth is. I don’t think the numbers in Figure 2 are any great shock to any statistician; but if the authors had to pre-register and/or give a stated rationale for why they deviated from the plan (which could be justifiable from a statistical standpoint) it would seem more difficult for the authors to make choices that moved the results in their preferred direction.

As for the second part: the statistical methods section of most published manuscripts tend to be maddeningly vague. All authors should have the option (or the mandate) to submit a more detailed methods appendix, possibly with their code, to illustrate more clearly what was done and why. Again, look at Figure 2 and see the variety of methods chosen. In a statistical methods section, this is too often confined to one or two lines - “Analyses were done using multivariable logistic regression using SPSS” with little further explanation. The ideal statistical methods section would provide enough detail that, if you gave me the dataset and data dictionary, I could fully recreate your results.

5 Likes

Hi,

I might add that the general notion of giving multiple researchers the same dataset and having them arrive at differing results, at least to some extent, is not a new topic.

Back in the 90’s, David Naftel at UAB was a valued mentor of mine. At the time I was working on the STS National Databases, developing risk adjustment models for operative mortality, with Fred Edwards and Richard Clark. We had both the benefit and the curse of having access to, for the time, huge datasets, with hundreds of thousands of observations.

David and I engaged in numerous discussions about the approaches one could take to developing multivariable models, including feature selection and so forth.

At least in part, predicated upon those discussions, in 1994, David wrote an editorial in the Journal of Thoracic and Cardiovascular Surgery:

Do different investigators sometimes produce different multivariable equations from the same data?
June 1994, Volume 107, Issue 6, Pages 1528–1529
https://www.jtcvs.org/article/S0022-5223(94)70434-1/fulltext

I would say that it is worth a read 20+ years later for perspective.

In the fall of 1995, I had the privilege of attending a research workshop at KU Leuven, co-hosted by Paul Sargeant at KUL, and UAB faculty, including David, John Kirklin and Gene Blackstone. The focus of the workshop was the team-based approach to analysis, where statisticians and clinical subject matter experts collaborate to derive reasonable results.

It is an experience that still influences how I go about analyses today and would advocate for others.

I might also remind of the oft-cited/paraphrased quote by George Box: “Essentially, all models are wrong, but some are useful.”
5 Likes

I think that quote is extremely relevant here. In a course about logistic regression, Stanley Lemeshow said something that changed my thinking. He said (paraphrased) that if you’d give a dataset to 5 different statisticians, you’d get 5 different models and there is nothing wrong with that.

Except in very special situations, I would actually be extremely surprised if many independent statisticians came up with the same model. It seems strange to me to even expect that. As far as I see it, there is seldom “the one” correct model to find but many different models that can be more or less equally useful.

The Silberzahn et al. paper provides evidence for that, as the majority of the odds ratios are very similar with overlapping confidence intervals. Also, I think the focus on statistical significance in the abstract is misleading: Figure 2 reveals that 27 out of 29 teams found a positive relationship between the soccer player’s skin tone and number of red cards awarded. I would feel quite confident to answer the posed question “whether soccer referees are more likely to give red cards to dark-skin-toned players than to light-skin-toned players?” with “yes” (or at least “probably”).

In summary, the fact that the reported odds ratios seem to be comparable both in magnitude and sign, despite the large variability of analytical methods is encouraging, In my view.

2 Likes

I am going to offer answers to John’s questions from a slightly different perspective, as a clinician educator.

What are the implications for observational research in cardiology and other areas of medicine?
Knowing the context of the study is important to interpreting the study conclusions.

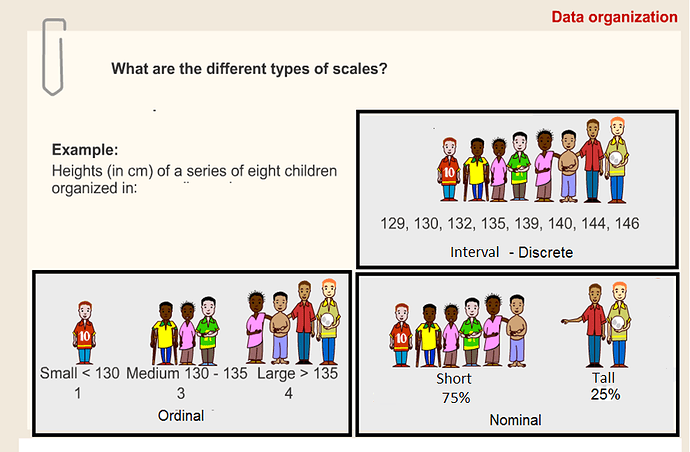
Imagine we ask 3 different investigators to measure the height of 8 children. The first investigator uses an discrete scale to give us 8 different values. The second investigator uses an ordinal scale, and reports 1 small, 3 medium, and 4 large. The third investigator uses a nominal scale and reports 75% short and 25% tall.

Based on these varying reports, I conclude that their is “significant variation in the measurement of data.” I suggest “these variations may be difficult to avoid” and note how “subjective measurement choices may influence research results.” I then pontificate on the implications of “subjective measurement choices” on the process of “scientific endeavors”, and conclude my study with the headline “scientists get different measurements to same data.”

Imagine I send this paper to a bio-statistician for review (not Frank, don’t want to give the poor fellow another headache). On the one hand, the statistician might agree with the conclusions that each investigator provided “varied measurement results.” On the other hand, the statistician might also think that this study doesn’t offer any new information. Of course the scale of measurement will change the way results are presented! That is why statisticians promote use of continuous measurements over unnecessary dichotomies.

We can have a long discussion on how to improve the choice of measurement scales in the scientific process (pre-define measures, always use continuous scales, etc). But it would be a stretch to draw a ton of conclusions about the “subjectivity” of scientific endeavors at large based on my study alone.

What are the take-homes for the practicing clinician?

For clinicians unfamiliar with statistical tests, this study does an interesting job highlighting how results can vary with different methods. The results may seem unsettling at first (is truth subjective?), but this is a known aspect of the scientific process. Improving the transparency of statistical test results goes beyond this specific article, and is part of a larger discussion on open data, pre-specified outcomes/methods, and reproducibility.

5 Likes

I think that’s a very fair one-paragraph summary.

1 Like

I admired David Naftel’s work a great deal and was fortunate to work with David, Kirkin and Blackstone. That collaboration is a shining star example of how collaborations should work. And it paid a great deal of attention to model specification to make sure it reflected the clinical realities. For that reason they used a different model for short-term surgical outcomes from the model for long-term survival, then pieced the two models together.

2 Likes

Thanks very much for sharing this. I’ve had a few brief interactions with David Naftel through some Intermacs projects, but I really enjoy pieces like this from the past - and have to admit, it makes me chuckle to see how generations of researchers seem to constantly “re-discover” the same things or re-live some of the same arguments. It’s certainly worth bringing this paper up in light of the Nosek paper and ensuring discussions.

Also, if all physicians were like Gene Blackstone, I daresay the advancement of methods in the medical literature would be significantly improved.

1 Like

I hope that we get more discussion to answer these two excellent questions. I would like to address some of the implications to the practice of statistics.

Experienced Bayesian modelers (I’m not there yet) have an elegant way to deal with model uncertainty by allowing for a parameter for everything you know that you don’t know. They then get posterior inference that accounts for such uncertainty, by making posterior distributions wider. Frequentist statisticians can use the bootstrap to account for model uncertainty, but results are harder to interpret, and the method does not get optimal shrinkage or accurate enough inference. With these things in mind, think about what happens in practice.

  • the statisticians pre-specify a relatively simple model and everyone hopes that it works. If the “distance” between this model and true unknown model is large (e.g., an important confounder was omitted or an assumption such as proportional hazards was strongly violated) the results may be very unreliable.
  • the statisticians do not pre-specify the model but enter the garden of forking paths to try different models, resulting in overfitting and more than anything resulting in false confidence (e.g., confidence intervals are far too narrow)
  • Bayesian statisticians do the same thing, resulting in posterior distributions that are too narrow

Over time I’ve become convinced that statistical models should be more complex, with penalization (shrinkage) that favors certain simplifying assumptions such as lack of interaction. With Bayes this is accomplished by having wide priors for effects that we believe will dominate (e.g., additive effects, monotonic effects) and with narrower priors for effects that may be real but we have reason to disbelieve (e.g., interactions, non-monotonic dose-response). If we think about a model that is a superset of multiple models that might have been entertained, and properly penalize ourselves for know knowing that a certain single model is “the truth”, we will have the right amount of uncertainty at the end.

Here is an example: you have an ordinal response variable Y and hope that the equal slopes assumption made by the proportional odds model does the job. You feel good about allowing the Y distribution to be completely flexible. But you entertain the idea that proportional odds is strongly violated. So specify a Bayesian multinomial logistic model for Y with priors that favor the proportional odds assumption. The PO assumption will “wear off” as the sample size grows, but when the sample size is not adequate for fully estimating the many parameters that the multinomial model has, the effective number of parameters estimated will be much smaller than the number in the multinomial model.

Quite generally, being honest about what you don’t know results in better decisions. Just pretending there is one relatively simple model is a mistake outside of Newtonian physics.

Was an approach such as the Bayesian one I outlined done in spirit in any of the 29 analyses?

6 Likes

What a great discussion!

This paper (and Stan Lemeshow’s quote) reminds me of an old joke I heard from a finance professor: If you ask 29 economists where the market will be a year from now, you’ll get at least 30 different answers, because one of them is going to hedge. I’m surprised that none of the analysts provided a different answer based on a sensitivity analysis!

For years I taught a course called Data Analysis and Report Writing, which was basically this paper done over and over. I gave the (stat and biostat) students a dataset and a vaguely worded question, and their job was to formalize the question and analyze the data. Not surprisingly the answers were all over the place. The important part of the exercise was when we would go back to the question and walk through how they got from the vaguely worded question to the statistical parameter that they felt answered the question. We could often reconcile differences at that stage. It showed them how important it is to formalize the question and to work with clinical or substantive colleagues to find out what they really want to know, which could then be translated into a parameter.

1 Like

What a fantastic exercise. I’ve not seen an exercise where formalizing the question was a formal part of the exercise. That is an extremely important part of epidemiology and biostatistics yet we don’t teach it enough.

Me too, and IMHO it casts doubt on the validity/aggressiveness of their sensitivity analyses. Results should be sensitive to assumptions. [But in general I’m not a fan of sensitivity analysis, but rather incorporating the uncertainties formally into the model as discussed above.]

1 Like

In a few discussions that I’ve had on Twitter about this paper, I’ve been trying to emphasize that THIS is the part of the Nosek paper which I find most interesting. I think people seeing the headline “statisticians get different answers from the same data” is misleading - to shallow readers, it sounds like we’re literally doing the math differently. But what happened here is very different - given a vague prompt, analysts followed different paths to derive their final answer, and that’s what we really should be discussing about this paper. The hows and whys of the decision-making in that stage of the process.

4 Likes

Nearly half the participants used the wrong approach (and refused to bulge even after interacting with the authors).
Slightly more than half, chose the correct way to handle this (a variation in the mixed model theme) but chose alternative still legitimate ways to analyze. These teams produced identical inferences (but they differed in numerical ways because of the different scales they worked at).

The article demonstrates the propensity of analysts to engage in mental and statistical masturbation than increase the level of analytical complexity to match the task at hand. It is interpreted as something entirely different though

1 Like

This observation on the Twitter discussion of the topic is spot on. My only fear is that the misleading conclusion is not from “shallow reading”, but “shallow application of mathematics”.

I find clinicians (myself included) often understand concepts without a good grasp of how to use/apply such concepts. To fix this problem, I suspect we need more applied math/stats in clinical training. But, I would be delighted to be wrong, especially if there are ways to improve statistical appraisal skills without more applied math!

If you give the same dataset to five statisticians you shouldn’t get five models. You should get five people asking you a lot of questions until they fully understand the data generation process and the nature of the research question.

A dataset is like a crime scene. We need to understand the processes that resulted in the data being as they are and to understand why we have been asked to investigate.

Giving a dataset with an inadequate description of the process and the question is bound to have statisticians using their ‘skill and judgement’ to supply the missing information, and, in most cases, probably not answering the real research question at all.

1 Like

I wish that were true. But I find that statisticians have such varying philosophies that you’d always get at least 3 models. Here’s a personal example. I am very aware of the literature on model uncertainty and especially on distortions of confidence intervals and standard errors if the proper transformation of the dependent variable Y is unknown. Because of that I almost always seek an approach that is transformation-invariant with respect to Y. That makes me routinely use semiparametric models for ordinal or continuous Y, and is a prime reason why our department at Vanderbilt and our graduate students do so much research on the use of ordinal models for continuous Y. Most statisticians are parametric with respect to Y.

Semiparametric and parametric models look different and, more importantly, can yield different estimates. Semiparametric models cannot be overly influenced by extreme values of Y, for one. And the model choice may even influence how one states the result, e.g., odds ratios vs. means (although thank goodness you can also estimate means from semi-parametric models).

Another philosophical difference: I believe that relationships are nonlinear until proven otherwise. So I routinely fit continuous predictors with regression splines and seldom use linearity as a default assumption for covariates.

One other: I believe it is just plain wrong to dichotomize a longitudinal measure just to make it easy to analyze. I see LOTS of statisticians modeling time to first event where “event” means something like the first time that glycohemoglobin exceeds 7.0. I think this is a dreadful power-losing approach and would always model HbA1c as a repeated longitudinal measurement (ideally using a semiparametric model).

3 Likes

I’m not disagreeing with you philosophically about this (for the purposes of appropriately characterizing the relationship between an exposure —> outcome) but I feel like this is driven at least partially by the desire to characterize patients into things like “diabetes” or “hypertensive” rather than accepting that the risk associated with these variables has a wider continuous spectrum. Docs like the idea of saying “(variable) is associated with a two-fold increased risk of developing diabetes” instead of “an increase of X in (variable) is associated with an increase of Y% in HbA1c” - even putting aside the “just to make it easy to analyze part” (which is also true, and something I have absolutely been guilty of in the past), it’s also often what the end-user feels is the thing they want to report.

I agree with Ronan in theory; I agree with Frank in the real world. I think you’re both right, actually - even if the statisticians ask a lot of questions and try their hardest to understand the data, research question, etc, you may still get different models for the reason Frank outlined (different philosophies, preference for different models, or just familiarity) as well as the reasons outlined in the JTCVS paper referenced here:

1 Like

It’s time that statistical experts choose the statistical attack. What feels best is too often wrong. And unnecessary, because a continuous analysis can always be re-phrased at the end to get any clinical estimate, including the probability that HbA1c > 7.0 at any follow-up time, the probability at all follow-ups, the probability at at least 2 times.

4 Likes