Please, I want to perform an interaction spline analysis for age (continuous) and Quartiles (categorical). My outcome is a survival outcome (incident stroke).
The focus is to compare Q4 to Q1 and allow hazard ratio to vary across age (continuous variable).
I fitted the model as;
spline.1 <- cph(Surv(years, stroke) ~  rcs(Age,3) + Q + rcs(Age, 3)%ia%Q ,
                      data = mydata)
Now I want to plot the hazard ratios and their confidence intervals across age.
I used the Predict function and had this output (first 10 observations); first panel of attache figure
spline.1_pred<-Predict(spline.1,Age,ref.zero=TRUE,fun=exp) ;
Dr. Harrell had advised that I use the contrast function, which I used.
However, the output I get from the contrast seems to be way different from what I get from the Predict function. Also, even though I specified the fun=exp in the contrast function, the outputs do not seem to be on the anti-log scale.
Below is the code I used for the contrast and the output. I added the exponentiated versions of the contrast estimates and their confidence intervals too.
contrast_spline.1 <-contrast(spline.1, list(Q="Quartile 1", Age=21:96),
                             list(Q="Quartile 4", Age=21:96),fun=exp)

## Getting the data and exponentiating

contrast_spline_df <- as.data.frame(contrast_spline.1[c('Age','Contrast','Lower','Upper')]) %>%
  mutate(Contrast_ex=exp(Contrast),Lower_ex=exp(Lower),Upper_ex=exp(Upper))
First 10 observations (second panel of the attached figure):
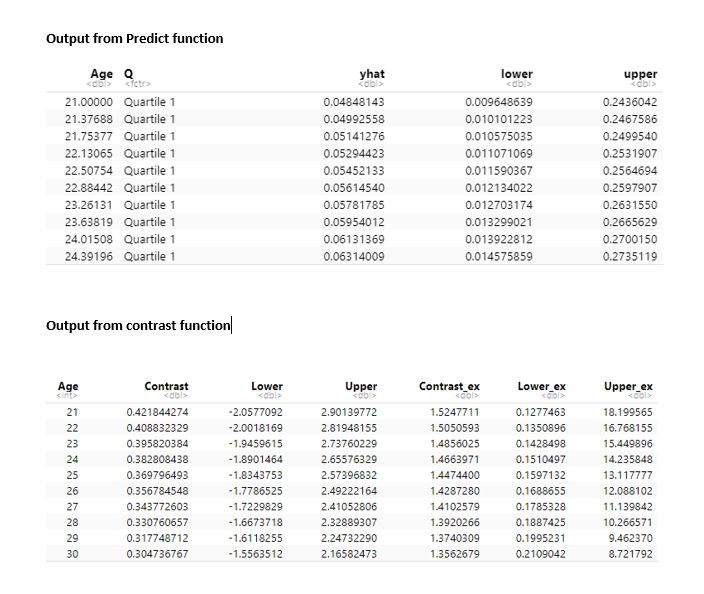
From the exponentiated estimates and confidence intervals for about the same age, the two (Predict and contract) yield very different estimates and CIs.
My questions are;
What am I doing wrong in the contrast function?
Is it appropriate to go with the results from the Predict function?
Secondly, I would be working with MICE data (10 imputed data) so I tried to fit the model to all the 10 imputed datasets and pool the results but I get an error when I try that.
This is the code I used:
spline.11 <- with(imputed_data,cph(Surv(MI_YrsFU, chd17) ~  rcs(Age,3) +
                                         Q + rcs(Age, 3)%ia%Q ))

spline.11_pooled <- summary(pool(spline.11), conf.int = T)
The error I receive when I pool the results is;
Error: $ operator is invalid for atomic vectors
How best can I work with the imputed data using cph function.
Thank you.