Today on Twitter there was an extensive conversation between several individuals involved in this site. The discussion concerned this paper (https://www.nature.com/articles/s41588-018-0183-z) which discusses polygenic risk scores. Reading the twitter discussion is difficult and the reason for this site is for more nuanced discussion. I’d like to hear a more long-form discussion here so that stronger arguments can be made.
It seems to me that there is fairly little evidence for the utility of PRS in general. It is very difficult to find any evidence that utilization of PRS scores leads to better clinical outcomes. I don’t think anyone strongly disputes this. I am more interested in the stated “statistical flaws” mentioned in the twitter conversation. What are the general statistical problems with PRS, aside from the already acknowledged underrepresentation of minorities in their construction? Are the effect sizes reliable in the studied population? What kinds of studies need to be done for us to get to the point of RCT’s comparing PRS guided treatment vs non?
FWIW, I think the data on their clinical role is a little better than was let on in that discussion. In both of these papers, that same team created polygenic risk scores that could be used with Framingham-like clinical risk scores. They then tested them in multiple statin RCTs. People with high PRS had greater absolute and arguably greater relative risk reduction from statins than those without.
The paper that was published this week was created with a substantially different technique to develop PRSs from a much larger dataset. Unfortunately, the new paper used the PRS alone, without making it a variable in a clinical prediction. So it’s possible that the predictive capacity would be much less if they also had BP, diabetes status, etc. It’s interesting they could make 5 PRS with decent ROC, but clinically I think it’s clear the prior scores were closer to ready for clinical use.
I agree there is evidence for their utility in stratifying treatment response but I’m not convinced this is clinically interesting unless it is drug specific. Either way, I think the only trial which would really answer whether or not they are effective in a clinical environment is “standard treatment (whatever risk models currently used) vs. PRS guided treatment + current risk models”. By little evidence of clinical utility I mean I have seen basically no trials with this design. I have seen poor attempts at this with small trials and poorly developed risk models but basically nothing testing a well developed PRS model vs. standard.
Regarding the Natarajan paper, there are a few statistical issues to explore.
Relative risk cannot be constant over a wide range of base risks. Would a different picture be seen with odds ratios, which can be constant when there are no interactions?
The high PRS score group is heterogeneous, including high-high PRS. And why should anything happen discontinuously at a cutpoint that someone imposed on PRS to classify it is “high”?
This should have been done as a smooth nonlinear interaction between treatment and PRS. I can’t imagine this not truly being a smooth relationship, if there is a relationship.
There are several statistical issues to explore, including:
The lack of adjustment for a full set of clinical and demographic variables.
Just how was the PRS derived? Methods that seek parsimony by favoring zero weights for large numbers of features may have overall good calibration, but the explained outcome variable is not competitive against methods such as ridge regression (or even naive Bayes) that do not force any coefficients to zero. More importantly, the probability that a parsimony-seeking approach chooses the right features is extemely low, and a stability analysis usually exposes extreme volatility in the list of features chosen.
As mentioned in the Natarajan article discussion, there is no reason to expect a discontinuity bump in PRS against outcome at a supposed cutpoint.
The practice of seeking an extreme subgroup to compare with the low-risk group is problematic in many ways, being arbitrary and subject to manipulation (in the choice of the cutpoint) and providing an exaggerated measure of information yield. And since neither the high-risk nor the low-risk group is homogeneous in risk, the meaning of such extreme comparison risk ratios is very unclear in a purely statistical sense. Had the authors repeated their exercise by comparing those greater than 85 years old with the rest, similar impressive ratios would result. This is not how we study risk factors.
On the last point, what is needed is a statistically sound, sensitive, and non-arbitrary measure. Here are some, as detailed here.
Compute pseudo R^2 which is based on the gold-standard log-likelihood (deviance) and is a very sensitive measure.
Compute the likelihood ratio \chi^2 statistic for a model that includes PRS and clinical//demographic variables, and the \chi^2 for a model that includes only clinical//demographic variables. Compute the ratio of these log-likelihood measures. This provides the fraction of predictive information in the whole set that is explained without PRS. One minus this is the fraction of new predictive information provided by PRS.
Draw a spike histogram (with 99 bins) showing the distribution of predicted risk using the “big” model, side-by-side with a histogram of predicted risk using only basic variables.
Compute the ratio of the variance of predicted risks for the reduced model to the variance of predicted risks for the big model. In ordinary linear models this ratio would be the relative R^2, i.e., what proportion of explained outcome variance is captured by a subset of the variables.
Make a scatterplot of x=predicted risk from the basic model vs. y=predicted risk from a model including PRS.
In addition to these issues, an unbiased full-resolution nonparametric or spline calibration curve (with no binning) is needed to demonstrate absolute accuracy of the complex model containing PRS.
I think your first point is the most practically important of the group. Without a fully adjusted model I think it’s impossible to determine whether (and how much) information is actually gained from a PRS. I fear collinearity with baseline risk factors will be a large problem which will dramatically reduce the utility of the PRS. Only baseline risk factors I could see not having any collinearity is age and smoking (granted those are both large effect variables).
In regard to points 3 and 4 I also agree that binning the risk in percentiles or in any other way is problematic from a predictive modeling standpoint. The only thing I’m not entirely sure about is whether this was done for demonstration purposes in the paper or if they are proposing actually modeling PRS in this manner. You’re proposed modeling method sounds pretty similar to what I would propose and I’m sure yours is more sound than mine.
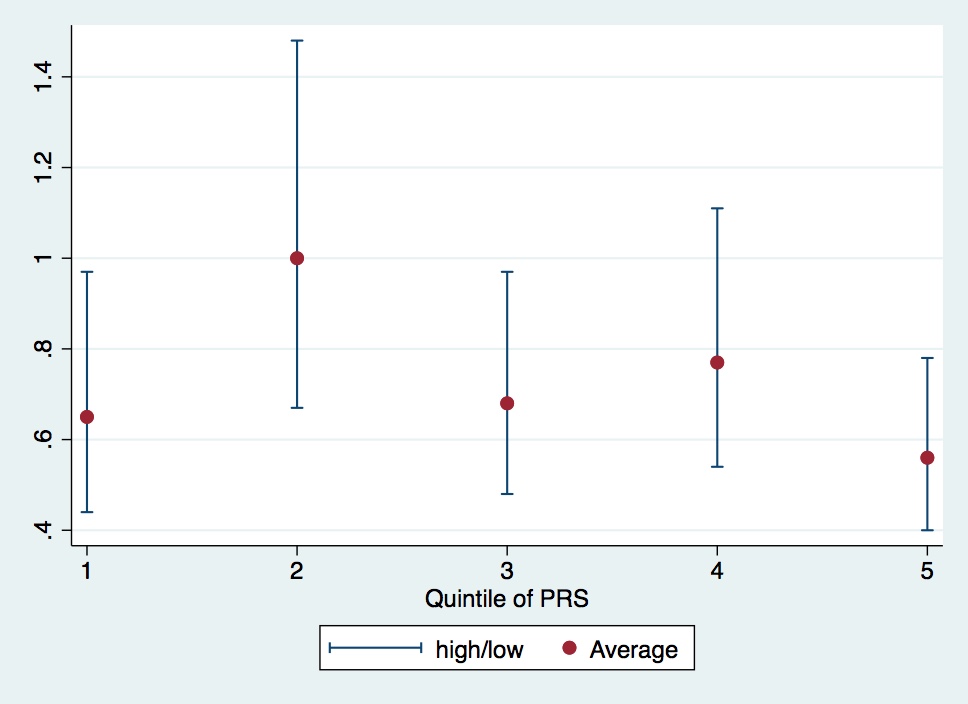
This paper is a teaching case for the hazards of binning. I made this from their table 2. Is there an overall trend? It would be important if there were. I honestly can’t tell, though I doubt it.
Oops. I was referring to Natarajan’s Circ paper “Polygenic Risk Score Identifies Subgroup With
Higher Burden of Atherosclerosis and Greater Relative Benefit From Statin Therapy in the Primary Prevention Setting.” This one uses WOSCOPS RCT and adjusts for Framingham-like variables. Right columns of table 2.
Related to the clinical utility of PRS from a screening perspective, this paper from January 2019 may be of interest. Since it’s paywalled, here are a few key quotes:
The problem, however, is that an odds ratio or hazard ratio does not directly indicate the discriminatory value of a screening test. To assess the discriminatory value, it is, whenever possible, necessary to specify the detection rate (sensitivity) and risk score cut-off for a given false-positive rate or the false-positive rate and risk score cut-off for a given detection rate. The detection rate is the proportion of affected individuals with a positive score. The false-positive rate (1–specificity) is the proportion of unaffected individuals with a positive score. Affected individuals are those who develop the predicted disorder over a given period of time and unaffected individuals are those who remain free of the disorder over the same period.
…
The Risk Screening Converter shows that the Khera et al. polygenic risk score gives a CAD detection rate of 15% for a 5% false-positive rate, which means that the score would classify 5% of unaffected individuals as positive and would miss 85% of affected individuals.
…
In summary, moderate relative risks (e.g., about 3-6) can have considerable significance in determining causes of disease. However, it is not well recognized that estimates of the relative risk between a disease marker and a disease have to be extremely high for the risk factor to merit consideration as a worthwhile screening test. To our knowledge, no genome-wide polygenic score meets this requirement, and none is likely to do so with polygenic scores that emerge in the future. It is important that the potential applications of genomic medicine are not compromised by raising unrealistic expectations in medical screening.
Here’s the citation for the paper: Wald, N.J., Old, R., 2019. The illusion of polygenic disease risk prediction. Genetics in Medicine. Redirecting
I feel that the Wald et al paper is looking at risk backwards, and are confusing classification with prediction. The most basic way to envision predictive discrimination is to draw a high-resolution histogram of predicted risks. Then various measures of explained variation can be derived from this, as detailed above. Whenever I see “false positive rate” (which is in fact not a rate but is a probability) I immediately think “unnecessary designation of positive using forced choice classification and arbitrary cutpoints.”