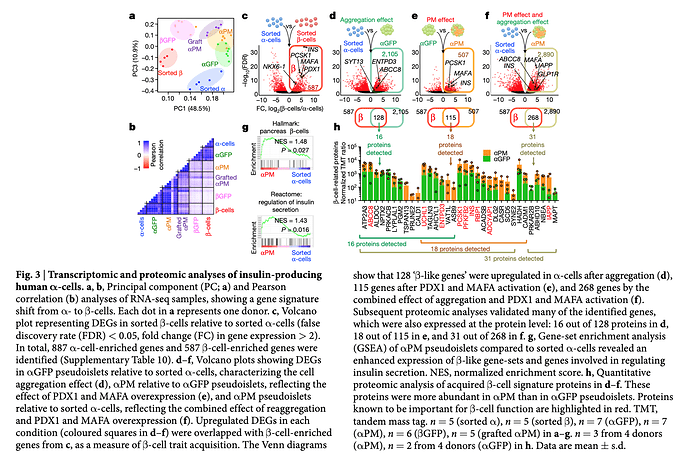
Bench biology is full of pre-post and especially longitudinal designs where the treatment is randomized prior to baseline so there is no a priori expectation of equal mean at baseline. Often the treatment is a knockout or similar construct. An example is a glucose tolerance test compared between a control (WT) and knockout (KO) groups. In this kind of experiment, the response variable (glucose level) is a response at baseline (We don’t think of the Y-variable as a “response” if treatment is randomized at baseline). An extreme example is Figure 3F here.
What is the appropriate longitudinal model for this?
- I would think if the groups at baseline are sampled from different populations (regardless of the measured difference), that is, if treatment is randomized prior to baseline, the correct model would be a longitudinal model with treatment*time fixed effects and modeling the correlated error due to subject. So not including baseline as a covariate but as the first time in the reponse.
- I would not think any ANCOVA-like model longitudinal model (y ~ baseline + time + treatment:time) would be correct specification because this would inflate the effects estimated by the interaction coefficients. Again – see fig 3F in the linked paper which shows almost parallel behavior in the glucose level over the whole time period (from 0 to 120 minutes) but an ANCOVA longitudinal model estimates what-I-think are overlly large treatment effects (the interaction coefficients) at post-baseline time points
Can someone point to any texts/tutorials on this? examples with R code?
