In a frequentist parametric survival model, median survival is simply calculated as exp(XB), with XP being the linear predictor (sum of the coefficients of all variables).
However, Bayesian statistics do not give point estimates of XP, but its continuous probability function. So for XP, I would not have a number but a continuous function. My basic question would be the following:
After a Bayesian model I get the 95% credible interval of the linear predictor.
If XPinf and XPsup are the lower and upper limits of that interval, then are exp (XPinf) and exp(XPsup) the limits of the 95% credible interval of the median survival?
Is the same true for the prediction of % of patients alive at fixed time?
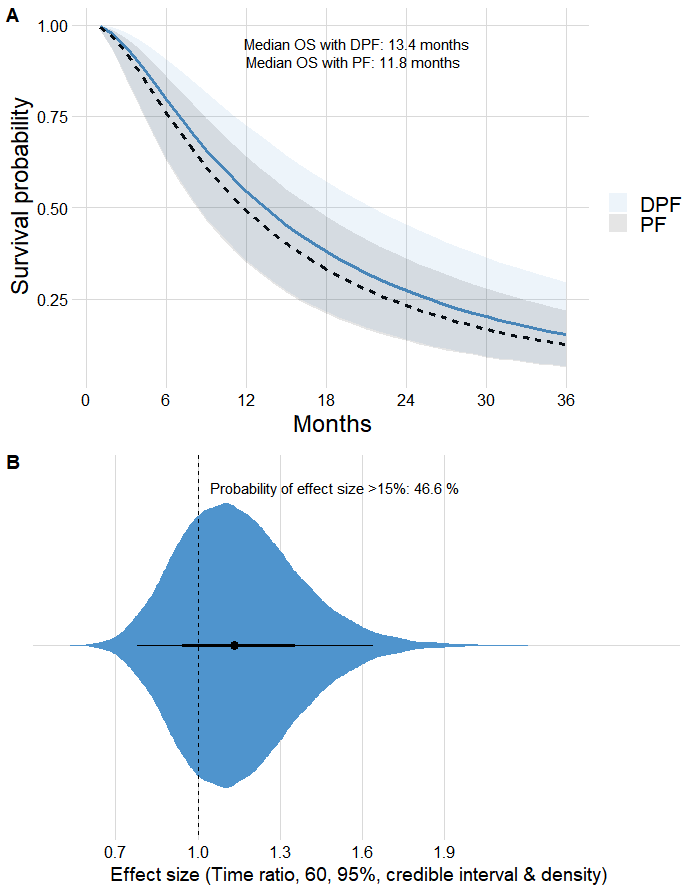
I’ve been working on these ideas to build an online Bayesian calculator and I wanted to know if this is right for the bands of the survival curve, as shown below.
The general idea with Bayesian models is that your write down a data model which gives you parameters for everything you don’t know, specify reasonable priors (not usually flat ones), and then you get the multivariate posterior density of all the parameters (or a large number of draws from that distribution as is usually done). Then when you have a derived quantity you get the exact distribution of the derived quantity. When sampling the multivariate posterior, compute the derived quantity for each draw and use those thousands of values to get the posterior distribution. Examples that may help drive this home is that in the new R rms package blrm function I get credible intervals for all model performance metrics (e.g. D_xy rank correlation) using this approach.
2 Likes
I think that’s how the above plot was made, so it’s probably OK. This afternoon I’m going to start testing your ordinal Bayesian extension of the rms package, if it’s already available, I’m sure some interesting issues will come up.
I can make a Linux or a Windows version available if you need it soon.
Yes, one of the multiple ideas we started thinking about in Spain during our lockdown was an ordinal model to predict quality of life based on the type of breast surgery (mastectomy or lumpectomy). The Bayesian approach based on rms would be very nice. However, I am still studying the issue of proportional odds and also the correct use of ordinal predictors to predict the response variable, also ordinal. I don’t know when the rms update is scheduled.
If you need it before it is updated on CRAN in a week or so let me know which operating system you use.
1 Like
Ok, it would be nice to start seeing if I can reproduce the Bayesian ordinal model, and its nomogram. I use Windows 10.
Is there an example of how ordinal predictors are used when approaching an interval scale variable?
To predict quality of life at 6 months I think I have to introduce the baseline quality of life into the model.
I’ll have a Windows version soon. Not clear about your last question. I have case studies for ordinal with a lot of categories (HbA1c example in RMS course notes.
Great! I’ve been checking out the HbA1c example in RMS.
I found it very very nice and enjoyed the reading very much.
My doubt is how ordinal predictors would be used, for example, ordinal symptoms scales (10-20 levels), or the ordered variable ‘quality of life’ with 100 levels. In a previous answer you suggested that the best approach was the Bayesian one, penalizing towards the ordinal variable. However, I don’t know if this is implemented in your pending rms package update.
On the other hand, elsewhere you said that in frequentist models you would use a quadratic polynomials.
So for example, for a scale with 10-20 levels should I use something like
Qol6month <- pol(15-item ordinal_score) + X1 + X2 ??
And for the scale with 100 levels?
Qol6month <- rcs(100-item ordinal_score) + X1 + X2 ??
Could I ever use splines?
Finally, I can’t reproduce the fig 15.1, which is very nice, it generates an error.
Quadratic is a decent approximation. I don’t handle ordinal predictors in my package in any special way. The R brms package does. Added a lot of new stuff today to <hbiostat.org/R/rms/blrm.html>