In an earlier discussion of multiple recurring outcomes within patients, Frank Harrell made a comment (quoted below) that I want to promote to a topic and add to. Here’s the core part of Frank’s comment:
Another contributor (@PaulBrownPhD) added literature links to some current approaches.
I have used multi-state survival models in other contexts, but I have worked with RCT data since then and just returned to multi-state models. There are a few issues that I think are key to improving the available methods:
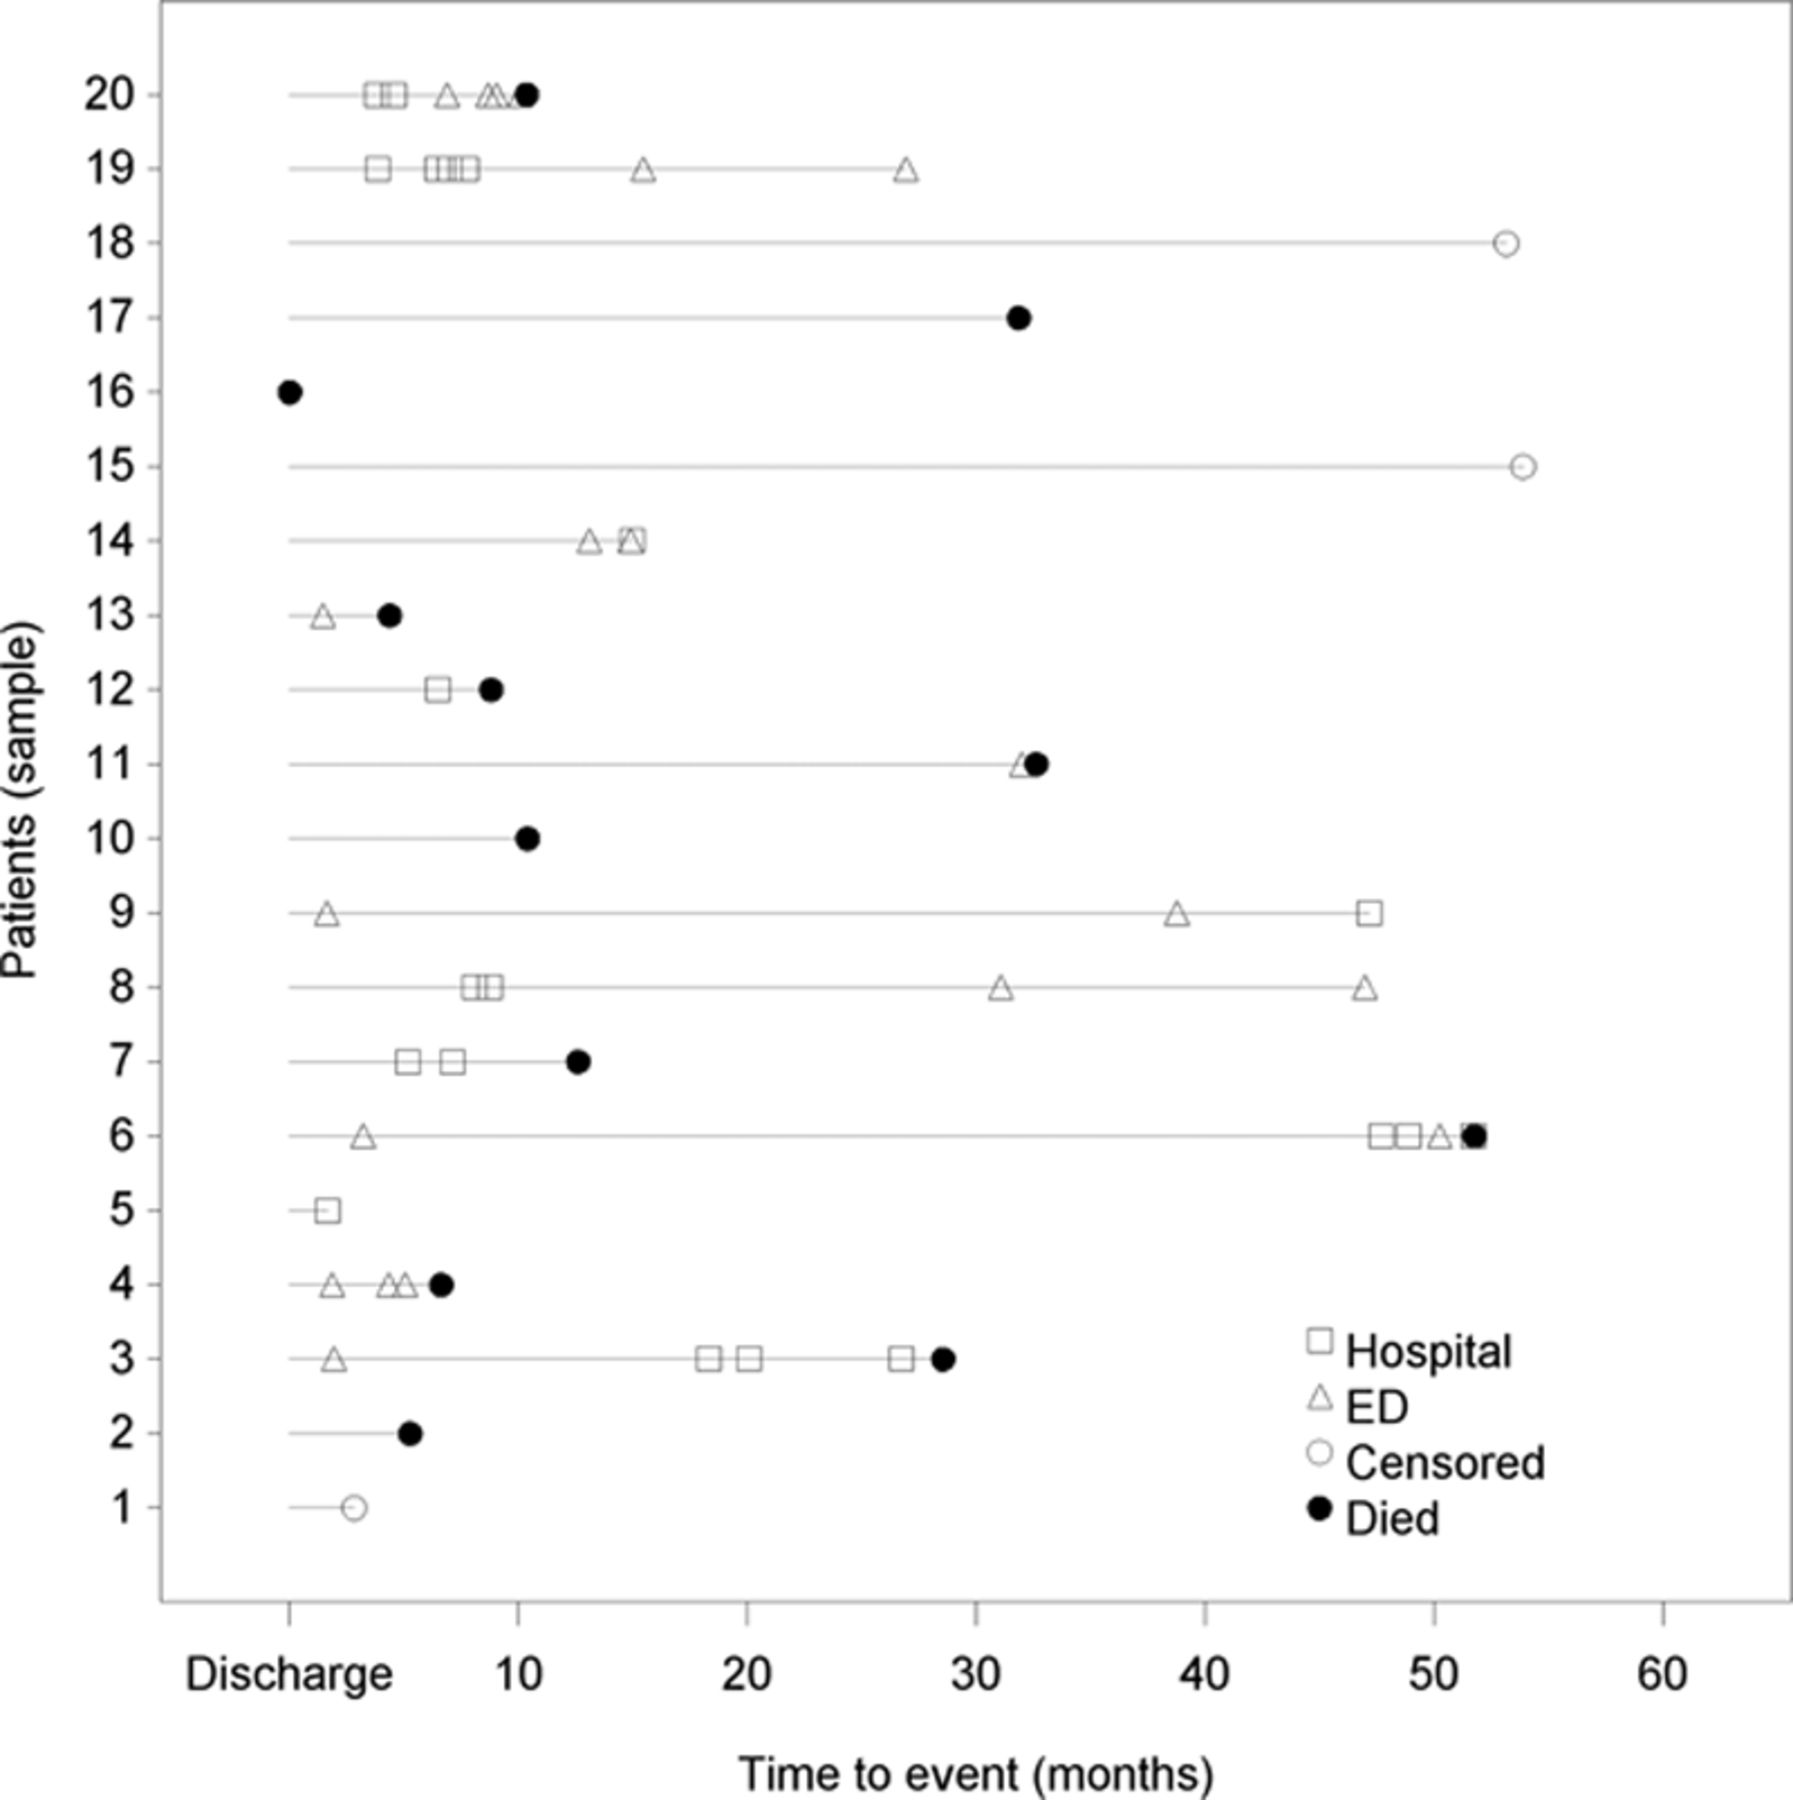
- Presenting patient-level data is difficult because both time-to-event (for each event) and the event type must Implicitly the time between certain events is different so there’s no guarantee that, for example, time from diagnosis to death should be presented as comparable to time from an adverse event to death. For patient-level data, the best method I have seen is the one used here, but also including coding for segments (e.g.-in-hospital intervals vs. at-home intervals). What are better presentations of patient-level data? Are there examples available that show categories in a format that is easier to read?
-
Presenting aggregated data is done either using structured tables or single-outcome survival curves. Both methods are ok but they do not do a good job of capturing the nature of the data. Are there better approaches to aggregated data multiple-outcome data?
-
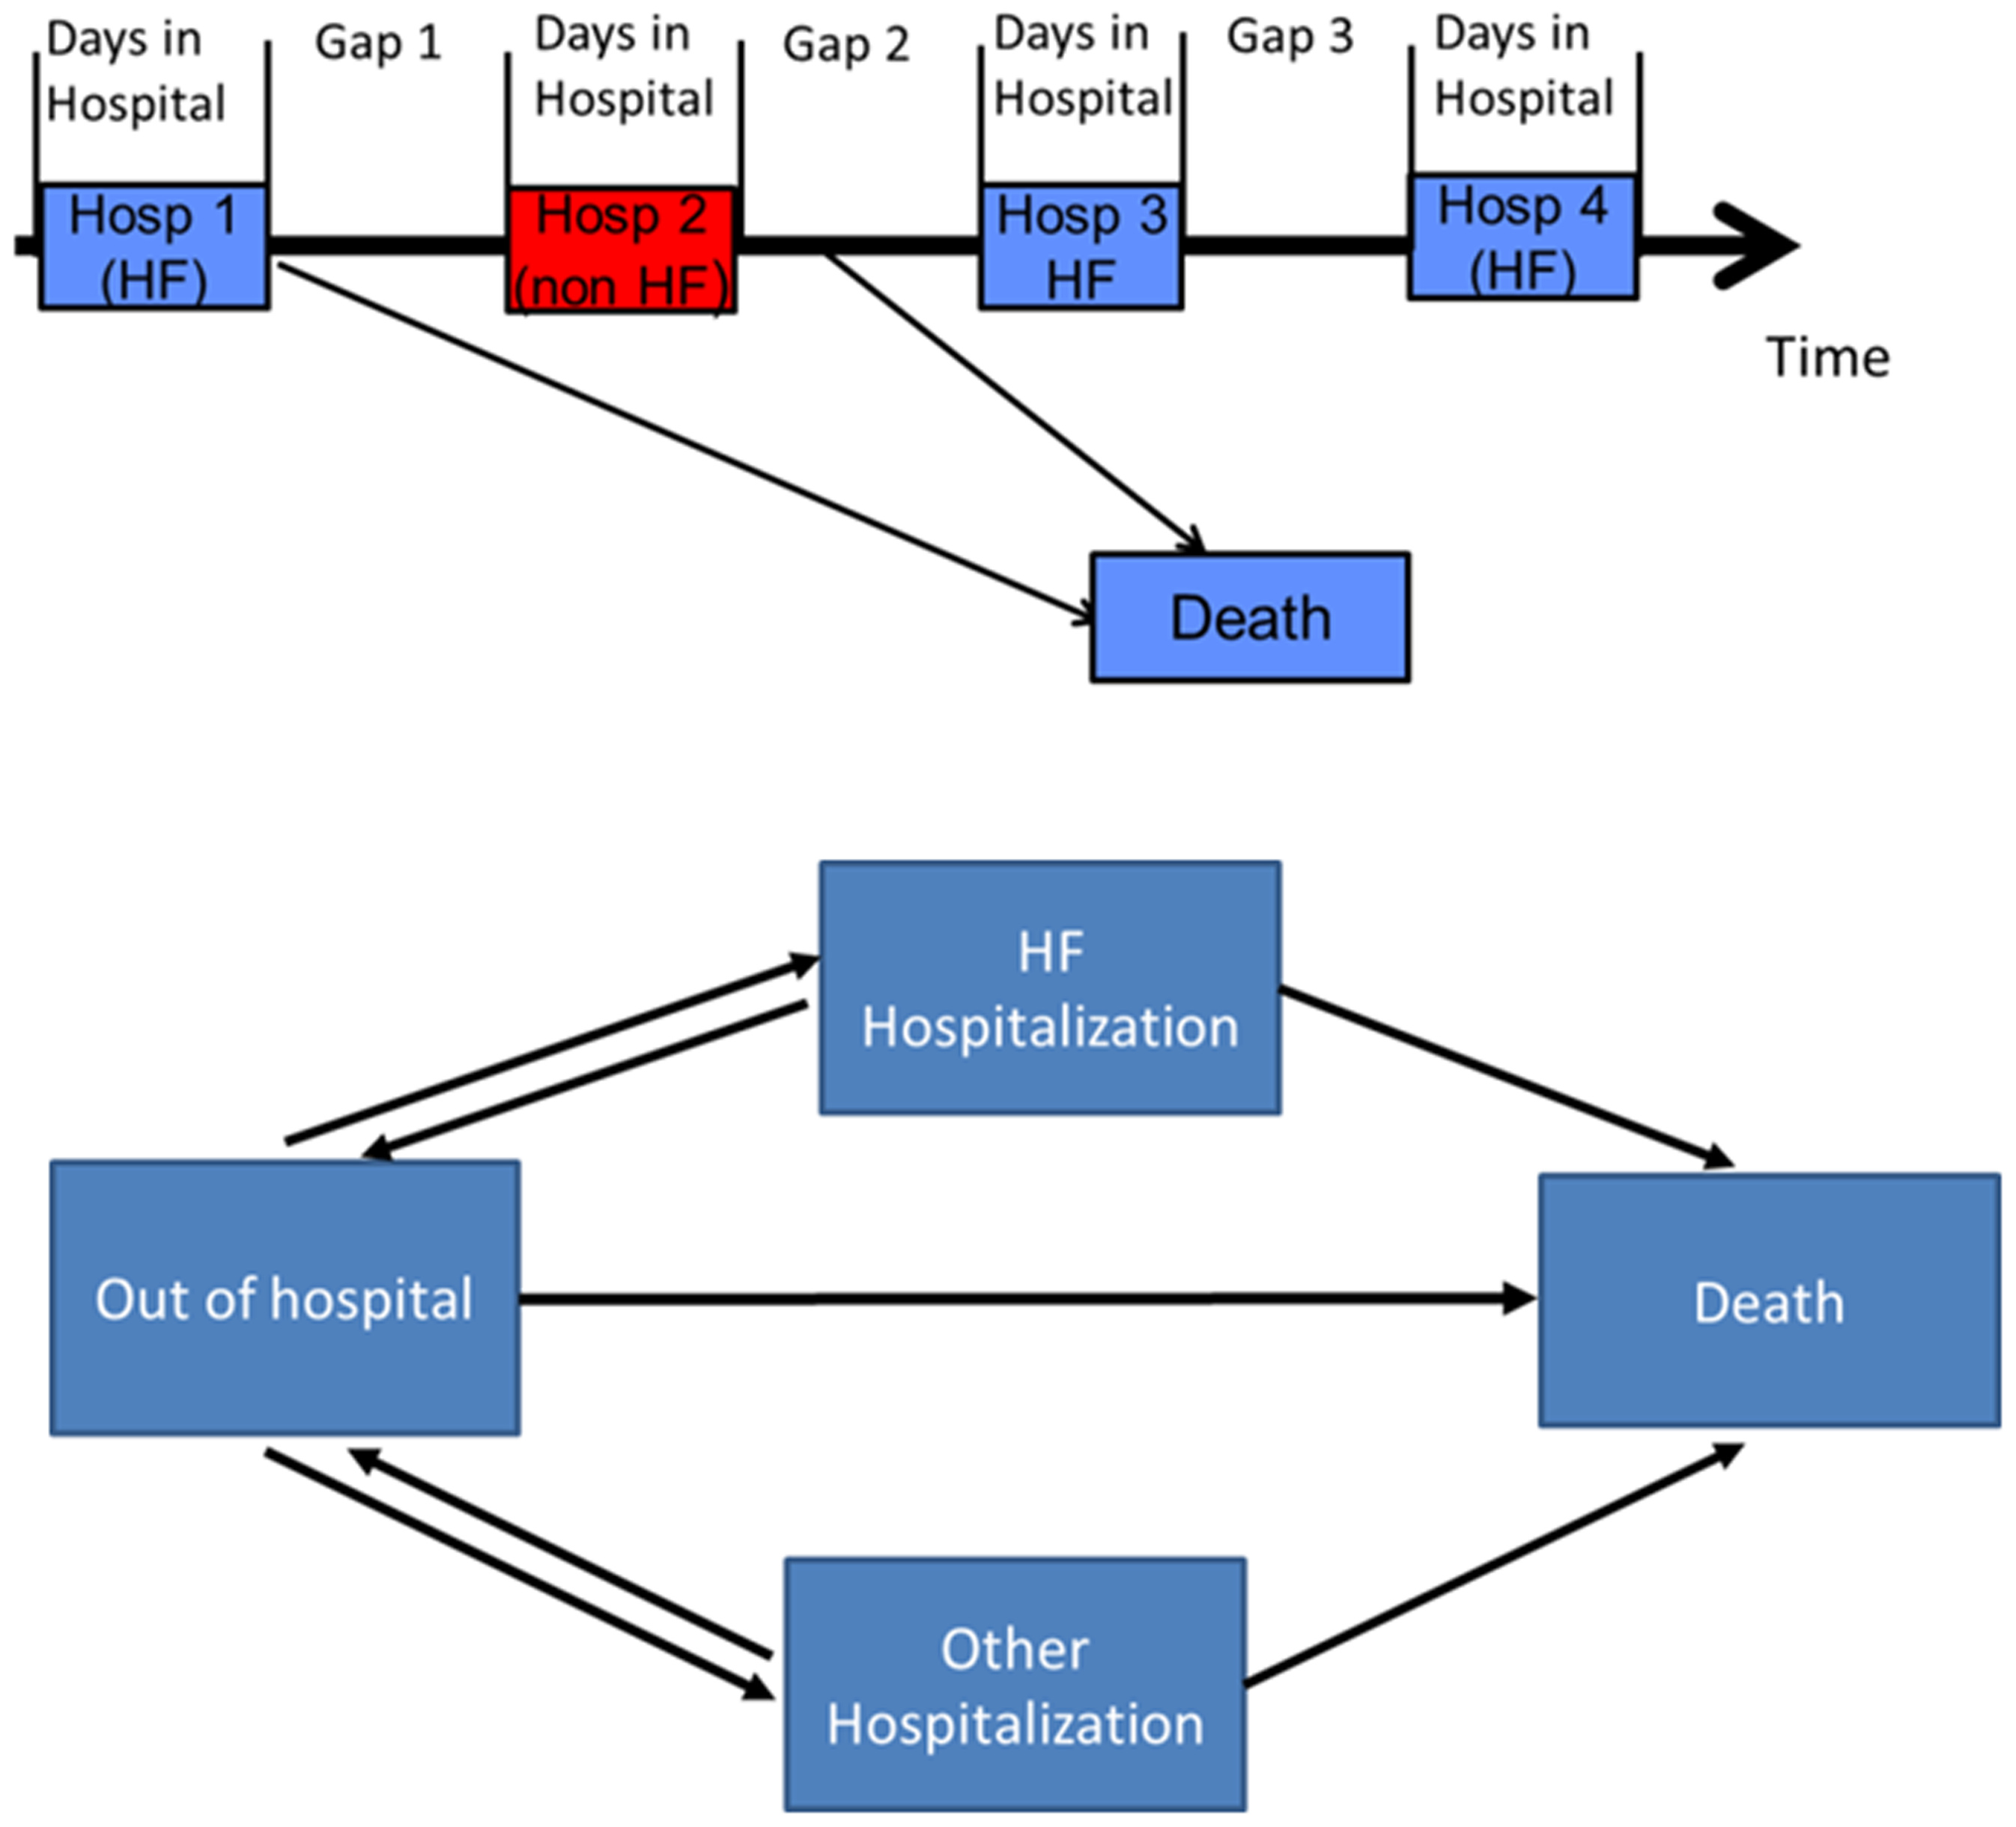
Unstructured multi-state models are very data-hungry and structuring them requires us to be clear about the transitions that are allowable and how they share parameters. One way this is done is using box diagrams but for more complex datasets it can be difficult to create a complete box diagram manually. In this case it’s fairly straightforward, but adding one more competing outcome would make for a very messy figure:
With that for background, what are your preferred approaches for
- visualizations of patient-level or aggregated data on transitions in this context;
- alternatives to tables and outcome-specific survival curves for aggregated data; and
- communicating about the transitions we want to “allow” in the model/data?
I want to make these methods more accessible and hearing from this community would be valuable to me. Thanks for any feedback!