I wholeheartedly agree that intervals for p1 - p2 obtained from Wilson intervals for p1 and p2 combined by squaring and adding (now known as MOVER - Method of Variance Estimates Recovery) are greatly preferable to Wald intervals - see Newcombe RG. Interval estimation for the difference between independent proportions: comparison of eleven methods. Statistics in Medicine 1998, 17, 873-890. Nevertheless, that is a quite separate issue. This issue with the NNT happens practically regardless of what method we choose to calculate the interval for p1 - p2. The Wald 95% interval for 47/94 minus 30/75, which is also used in my book, is simply the perfect example to illustrate this point as it happens to give these round figures for p1 - p2 and both lower and upper limits to 4 dp.
The confidence interval anomaly arises because the NNT is a reciprocal of a quantity (the risk difference) whose value can cross zero. A similar thing happens with Fieler’s Theorem. I seem to recall Andy Grieve writing about this many years ago. I see little use for NNTs anyway so I have never got very excited about this.
I going to offer a partial defense of NNT.
NNT often acts as an “infographic” to quickly visualize comparative effectiveness of different interventions. Physicians can quickly see magnitude of benefits and harms of different interventions for a single patient, or magnitude of benefits and harms for a single intervention for different patients with different baseline risks. This is helpful to the average physician! For example, take this figure from a 2005 buisiness week article:
Despite all its limitations, the NNT still works well in certain scenarios. How often do the listed limitations apply?
1) Loses frame of reference: most event rates are low; interventions with ARR 0.93-0.92 are rare. I would argue this as “not often”.
2) Group Data to individual: this is an issue with all absolute values. This limitation always applies, but is also unavoidable.
3) Group Decisions: NNT is a decision support. Their is always a fear that decision supports will inflict the tyranny of averages without consideration, but in practice patient care is more nuanced. I would argue this as “not often”.
4) NNT has great uncertainty: this is a valid point, the NNT is rarely presented in a range. This is sort of like a design choice to keep “visualization” simple. I would say this limitation “often applies”, but the option to present a range is always possible.
5) NNT is poor choice for shared decision making: This is tricky. As a value question, it depends on context, patient education, alternative communication options, use of visuals, etc. I am uncertain of this as a limitation.
6) NNT omits timing: This is a valid point. The NNT is rarely presented with the length of study time. This is less of an issue for acute problems or survival numbers, and becomes a bigger problem for chronic conditions. I would say this limitation “depends”. For Emergency Medicine (acute problems) its “not often”. For Primary Care, its “very often”. The option to present NNT with time-range is always possible, but also makes comparing interventions more difficult.
Out of all of these limitations, #2, #4, #6 are probably the most commonly encountered.
If we want to remove NNT, we need an equivalent “infographic” replacement that serves the same function (provides quick and easy way to interpret comparisons). Certainly, if an alternative can improve on the big limitations from above, we may have an argument against using NNT. Until then, I suspect the NNT will continue to be used. For most users it is still a helpful clinical decision aid.
The graphic would be incredibly more useful had the average risk for untreated individuals been side by side with the average risk for treated individuals. Next to that put thermometers to indicate absolute risk difference.
This is not an issue with absolute values. You can estimate the risk for an individual patient. This problem is very avoidable.
NNT is not made for decision support. It does not apply to individuals. Absolute risk estimates (separate for untreated and treated patients) are much more directly applicable to decision support.
This is related to the point above. Shared decision making needs to consider absolute risks (untreated, treated) or life expectancies (untreated, treated). The fact that some hypothetical group of “others” is out there is not relevant at the decision point.
I’d like us all work together on an optimum visualization that provides the data that are fed directly into decisions. In a second phase, a graphic that shows how to apply the first step to patient utilities to recommend the optimum decision would be another good goal IMHO.
As an informaticist, I think this would make an interesting project (i.e. a web-based interactive graphic). It could also be useful for visual abstracts, etc.
Presumably it would include ranged inputs for [baseline risks] [relative risk] and output [absolute risk].
Does anyone have suggestions or mock-ups for how it could look?
Thanks.
For a general audience I’d suggest sticking to only absolute risk. Note that a simple graph can be used to convert odds or hazards ratios and baseline risk to risk differences, as in this. Instead of that I propose that we find a way to present the two absolute risks, make the time frame apparent, and show the risk difference. To help in the communication it would be good to add some points of reference in separate rows of the display, e.g. risk of a 50 year old from the general population dying within 10 years whether or not he drives 100,000 miles. Relative treatment effects could be shown as footnotes.
For the decision analysis part, start with this paper.
David Spiegelhalter has written a lot about risk communication.
 On further reflection I think your idea of making this interactive is a good one, because RCT reports only include crude average treatment effects on an absolute scale. Fortunately they provide relative effects for binary outcomes (these really need to be covariate adjusted; crude odds ratios will underestimate the conditional odds ratios). So the interactive component could ask for a patient’s baseline risk, showing as an example the average risk for patients enrolled in the trial, and compute the absolute risk with and without treatment.
Confidence limits for the published relative efficacy could also be factored in, resulting in a confidence interval for the predicted absolute risk for a treated patient, assuming no uncertainty in the baseline risk estimate.
@f2harrell I have a conference presentation coming up where I used shinydashboard and highcharts to do a quick and dirty version of this idea. Would love to hear your thoughts (and wish I thought to ask you sooner!). Basically used the OR outputs of a network meta-analysis to allow clinicians to enter local event rates + preferences as a decision aid. Plenty of limitations (some of those credible intervals are clearly not credible) but it’s an idea I hope to develop.
Wow Tim that is really cool.
I’d like to see a streamlined app that dealt with results of a single trial and with one clinical outcome.
Super cool @timdisher! I’d add to @f2harrell, that it would be really nice to have a general infrastructure which could be reused across individual trials and outcomes.
Thanks @venkmurthy and @f2harrell. Creating just the absolute probability plots with sliders for assumed baseline rates of a single outcome would be amazingly simple on a trial by trial basis but more difficult to have be general since I currently use mcmc draws to account for both baseline rate and model parameter uncertainty (while respective correlation between coefficients in the latter). For this to work and be correct/not have to make distributional assumptions about the posterior people would need to upload their mcmc matrix output.
@f2harrell In economic models we often will use cov matrix of the model if frequentist to draw from a pseudo posterior to assess parameter uncertainty but the purest in me hates this for obvious reasons. Can you think of a better solution?
The idea of admitting uncertainties in risk estimates is so appealing that I think an R Shiny app should operate on 10,000 stored posterior draws.
Apologies to @f2harrell and @timdisher, I am late to this conversation as I missed the responses from earlier this week. I really like the shinydashboard! A neat way to show complex interaction of baseline risks and interventions.
I think it would be great to have multiple examples and visuals, and hopefully more folks will post any similar projects they have. I will also try to put something together and post in the next week.
I like Raj’s partial defense of the NNT. And he does note that it is rarely presented in a range – i.e. with a CI. This is partly for brevity, as in Raj’s table. However, there is a serious issue with the NNT in the non-significant case, where the interval for the risk difference includes zero. There are serious problems even when none of the cell frequencies is small. Suppose we wish to compare the success rates on two treatments, 47 out of 94 (50%) and 30 out of 75 (40%). The estimated difference here is +0.1000. The 95% Wald interval is -0.0500 to +0.2500. Naively inverting these figures results in an NNT of +10, with 95% interval -20 to +4.
Normally the lower and upper limits for the NNT come from the upper and lower limits for the risk difference. This does not apply here. Instead, the calculated interval actually excludes the point estimate, +10. Conversely, it includes impossible values between -1 and +1, including zero. The explanation is that the calculated limits, -20 and +4, are correct. But the interval that these limits encompass must not be regarded as a confidence interval for the NNT. In fact, it comprises values of 1/risk difference that are not consistent with the observed data. The correct confidence region is not a finite interval, but consists of two separate intervals extending to infinity , namely from -infinity to -20 and from +4 to +infinity. While a confidence region of this nature is perfectly comprehensible to a mathematician, one would not expect clinicians to be comfortable with it as an expression of sampling uncertainty.
This explanation will help many clinicians. Big picture: NNT should not be presented, but if it is presented it should not be presented without a compatibility/uncertainty/confidence interval. If presented with an interval the interval needs to be correctly computed. And the interval will be disappointingly wide to many clinical researchers.
The issue is not that the interval needs to be correctly computed. The two calculated limits need to be correctly interpreted.
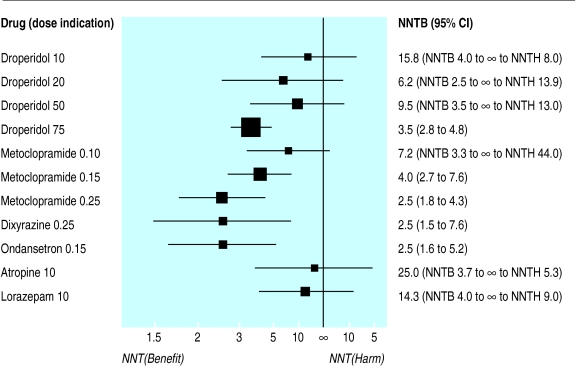
Agree with this criticism. I will add for reference Altman’s evaluation of this problem and his sensible solution for better presentation.
Per article, Altman’s suggests he thought of NNT (or NNTB/NNTH) as a “valuable concept”, but other may be able to better comment if this was a compromise of convenience.
https://www.ncbi.nlm.nih.gov/pmc/articles/PMC1114210/
FWIW, I have not presented a NNT to an individual patient since residency. It is confusing, has a lot of caveats, and has the “smushing 2 numbers into one” problem. Perhaps better for population/health insurance decisions with CIs, but I don’t run a heath insurance company
Here’s a new relevant commentary: The number needed to treat: It is time to bow out gracefully by Murad et al, 2025.